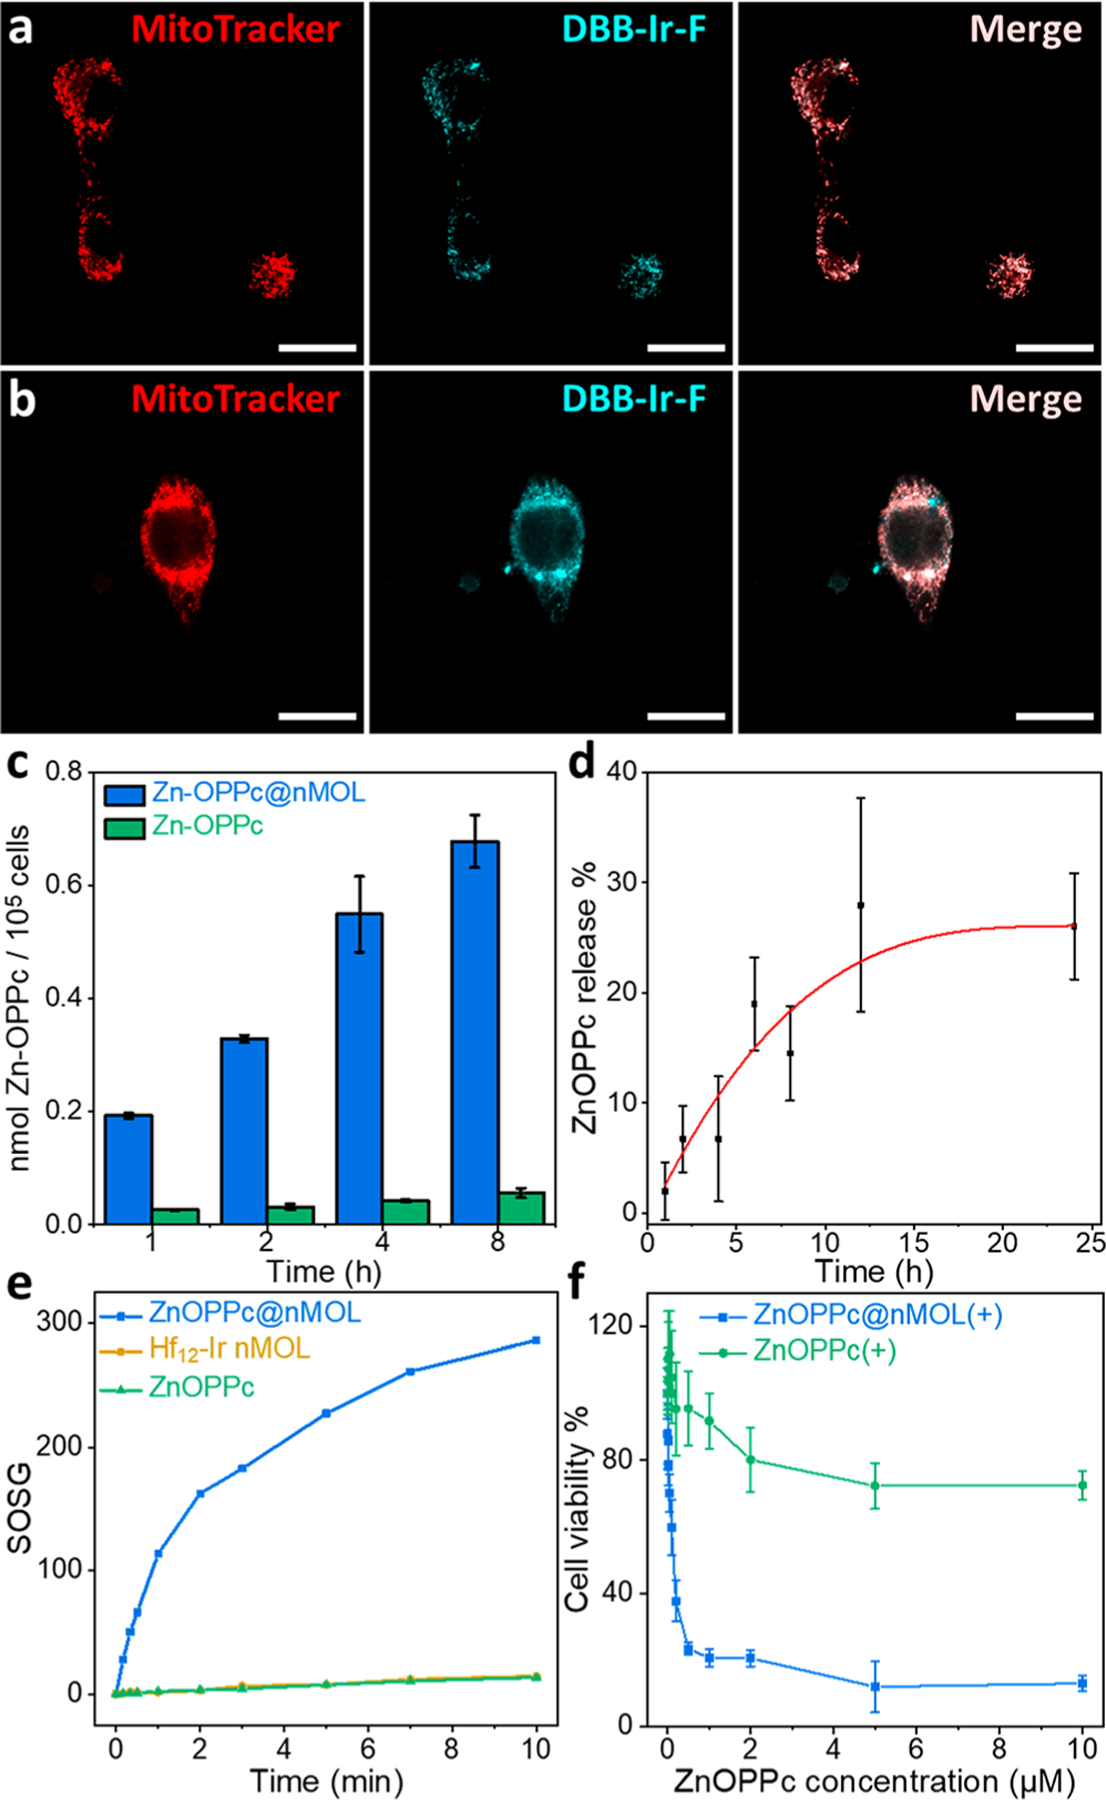
Figure 3.

Hf12-Ir nMOL (a) and ZnOPPc@nMOL (b) colocalized with mitochondria as visualized by CLSM after a 2 h incubation with MC38 cells (scale bars equal 20 μm). (c) Cellular uptake quantified by UV–visible spectroscopy, N = 3. (d) Release profile of ZnOPPc@ nMOL in PBS, N = 3. (e) 1O2 generation of ZnOPPc and ZnOPPc@ nMOL detected by SOSG assay. (f) MTS assay of PDT treatment with ZnOPPc or ZnOPPc@nMOL on MC38 cells, N = 6.
