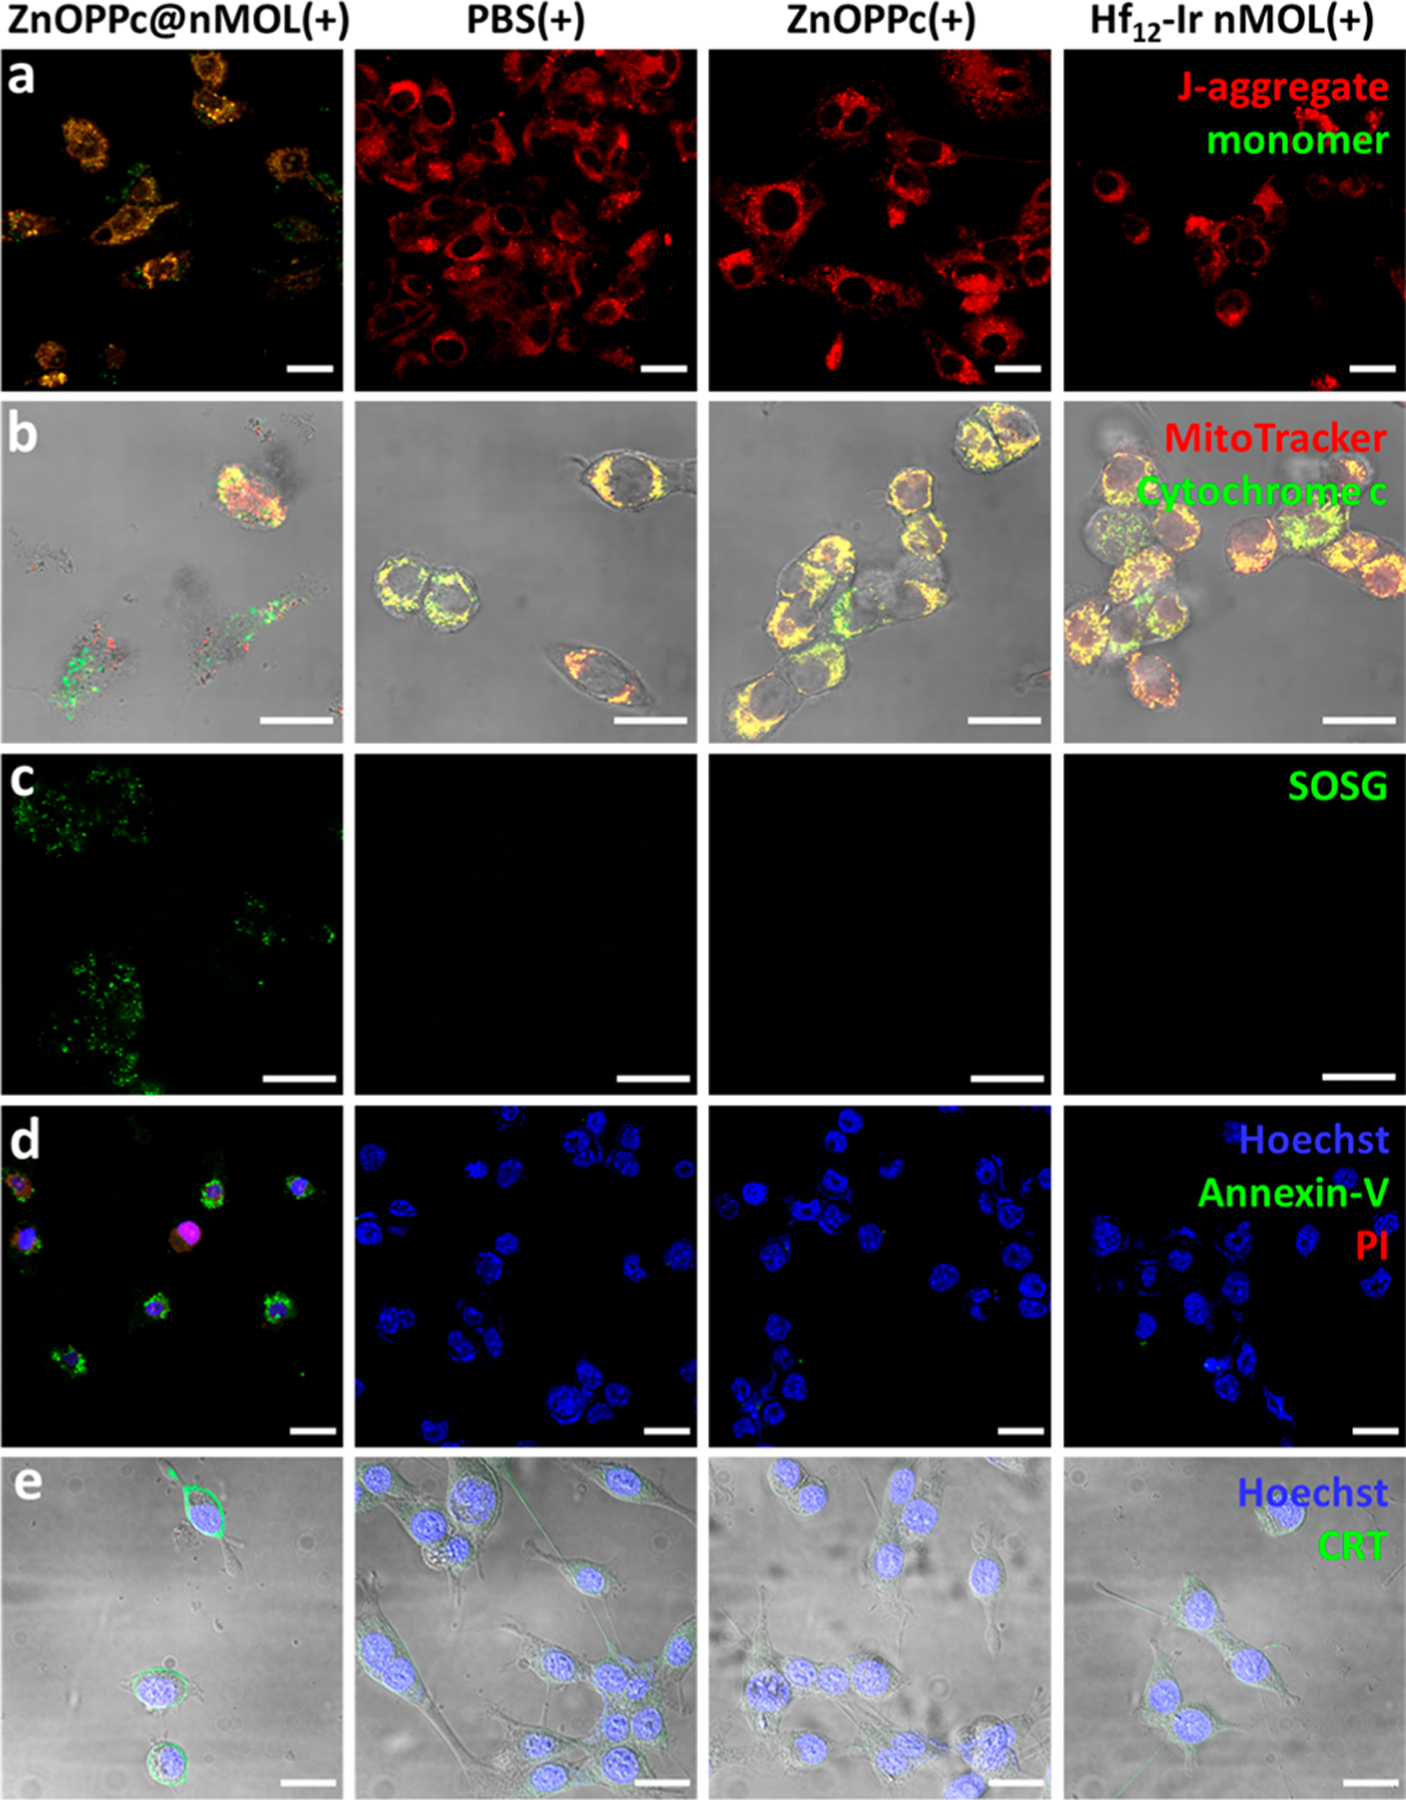
Figure 4.

(a) Loss of mitochondria membrane potential by the JC-1 assay. Red channel indicates J-aggregate and green indicates monomer form of JC-1 molecules. (b) Release of cytochrome c (green) from mitochondria (red). (c) 1O2 generation by the SOSG assay (green). (d) Cell apoptosis visualized by annexin-V (green) and PI (red) staining. (e) ICD detected by CRT expression on the cell surface (green). Cell nuclei were stained by Hoechst 33342 (blue) in (d) and (e). MC38 cells were used, and all scale bars equal 20 μm.
