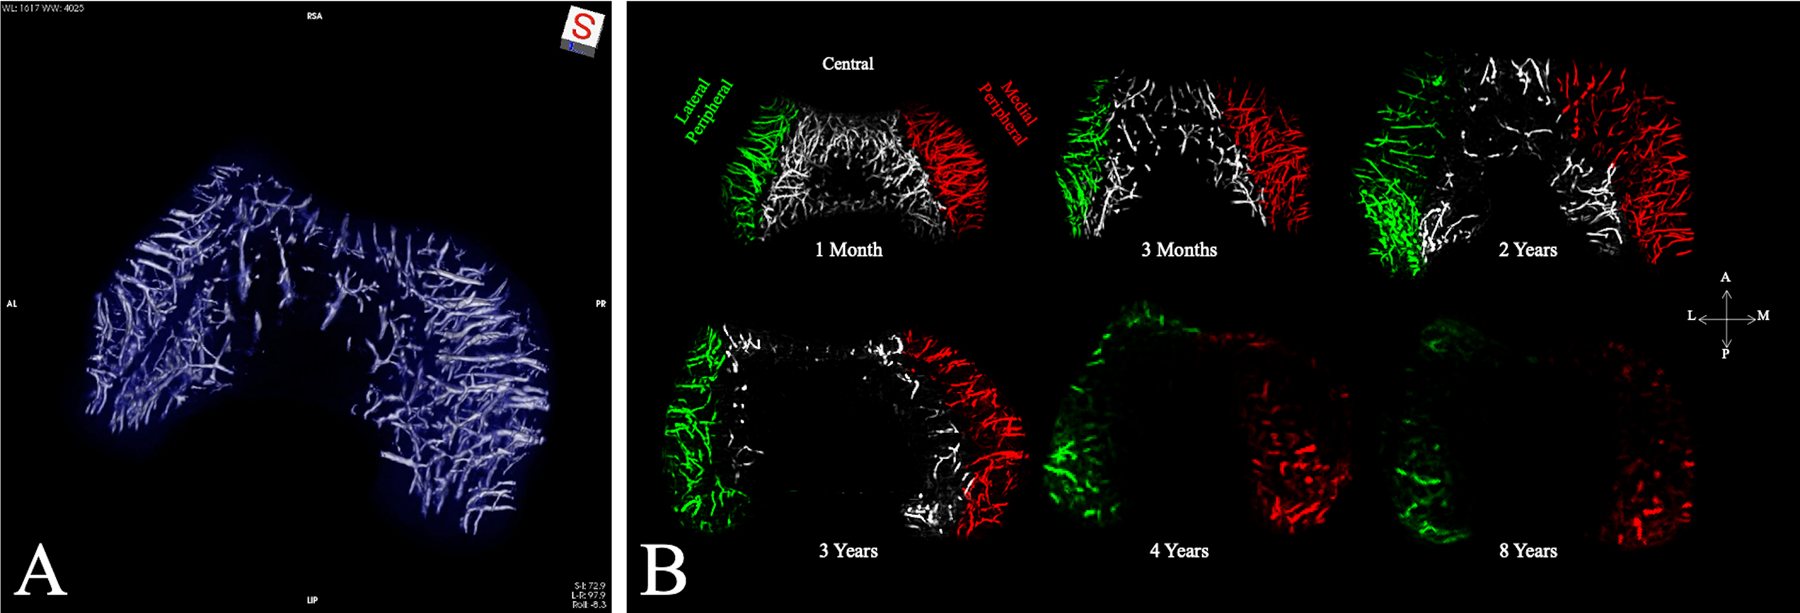
Fig. 2.

Figs. 2-A and 2-B Three-dimensional quantitative MRI demonstrating vascular watershed zones and regression. Fig. 2-A Three-dimensional reconstruction of susceptibility-weighted MRI data obtained from a distal femoral specimen from a 3-month-old human cadaveric donor demonstrating axial (central) and abaxial (peripheral) vascular beds with an avascular region in the midsagittal plane. Fig. 2-B Visualizations and density changes in vascular network with age. Maximum-intensity projections of the quantitative susceptibility mapping-post-processed vessel-enhanced (vesselness) maps from 6 selected cadaveric specimens with increasing age are shown. The vasculature is color-coded according to the vascular network (lateral peripheral = green vessels, central = gray, and medial peripheral = red). No central network was observed in the specimens from donors who were ≥4 years old. By 8 years of age, there was a small, residual peripheral vascular network. At 10 years of age (not shown), no substantial epiphyseal cartilage vascularity could be detected. A = anterior, L = lateral, M = medial, and P = posterior. (Modified, with permission, from: Ellermann JM, Ludwig KD, Nissi MJ, Johnson CP, Strupp JP, Wang L, Zbýň Š, Tóth F, Arendt E, Tompkins M, Shea K, Carlson CS. Three-dimensional quantitative magnetic resonance imaging of epiphyseal cartilage vascularity using vessel image features: new insights into juvenile osteochondritis dissecans. JBJS Open Access. 2019 Dec 5;4[4]:e0031. Reproduced with permission.)
