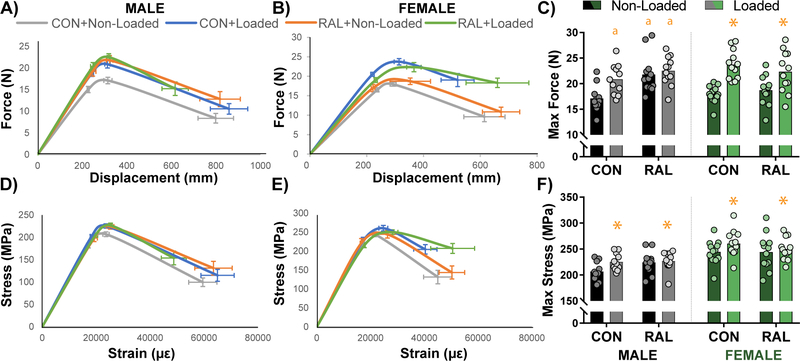
Figure 4.
(A) Averaged force-displacement plots for male mice show an upward shift in the strength of tibiae that received loading, RAL, and both. (B) In female mice, improvements in mechanical properties was primarily driven by loading, as can be observed in (C) maximum force. After normalizing to cross-sectional area, stress-strain plots for (D) male and (E) female showed similar results as the force-displacement plots, as can also be observed in (F) maximum stress. Plots are shown as average ± SEM. For a two-way ANOVA, a ‘&’ indicates a main effect of RAL and an ‘*’ indicates a main effect of loading. If the interaction term was significant, an ‘a’ indicates a significant difference from non-loaded control, ‘b’ indicates a significant difference from loaded control, and ‘c’ indicates a significant difference from non-loaded RAL.

