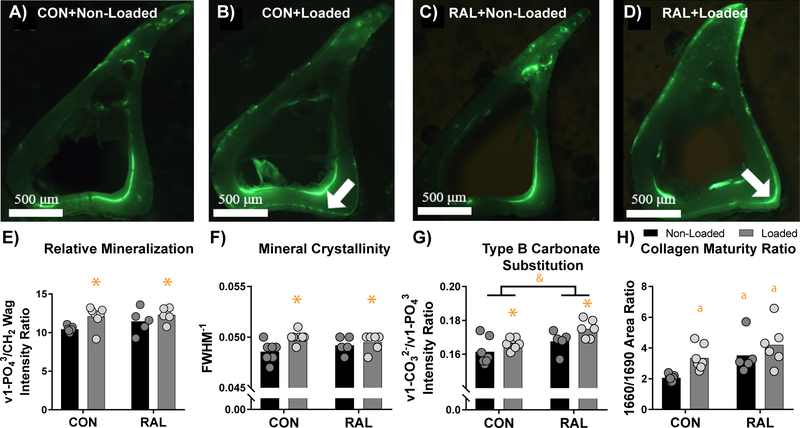
Figure 5.
Raman spectra of newly formed bone were acquired in (A) non-loaded control, (B) loaded control, (C) non-loaded RAL, and (D) loaded RAL tibiae using fluorescent calcein labelling for visualization. White arrows show regions of periosteal bone growth in the loaded limbs. (E) Relative mineralization and (F) mineral crystallinity were both elevated due to loading, while (G) Type B carbonate substitution was increased due to RAL. (H) Collagen maturity ratio indicated increased collagen maturity due to both loading and RAL. For a two-way ANOVA, a ‘&’ indicates a main effect of RAL and an ‘*’ indicates a main effect of loading. If the interaction term was significant, an ‘a’ indicates a significant difference from non-loaded control, ‘b’ indicates a significant difference from loaded control, and ‘c’ indicates a significant difference from non-loaded RAL. Arrows indicate locations of new bone growth.

