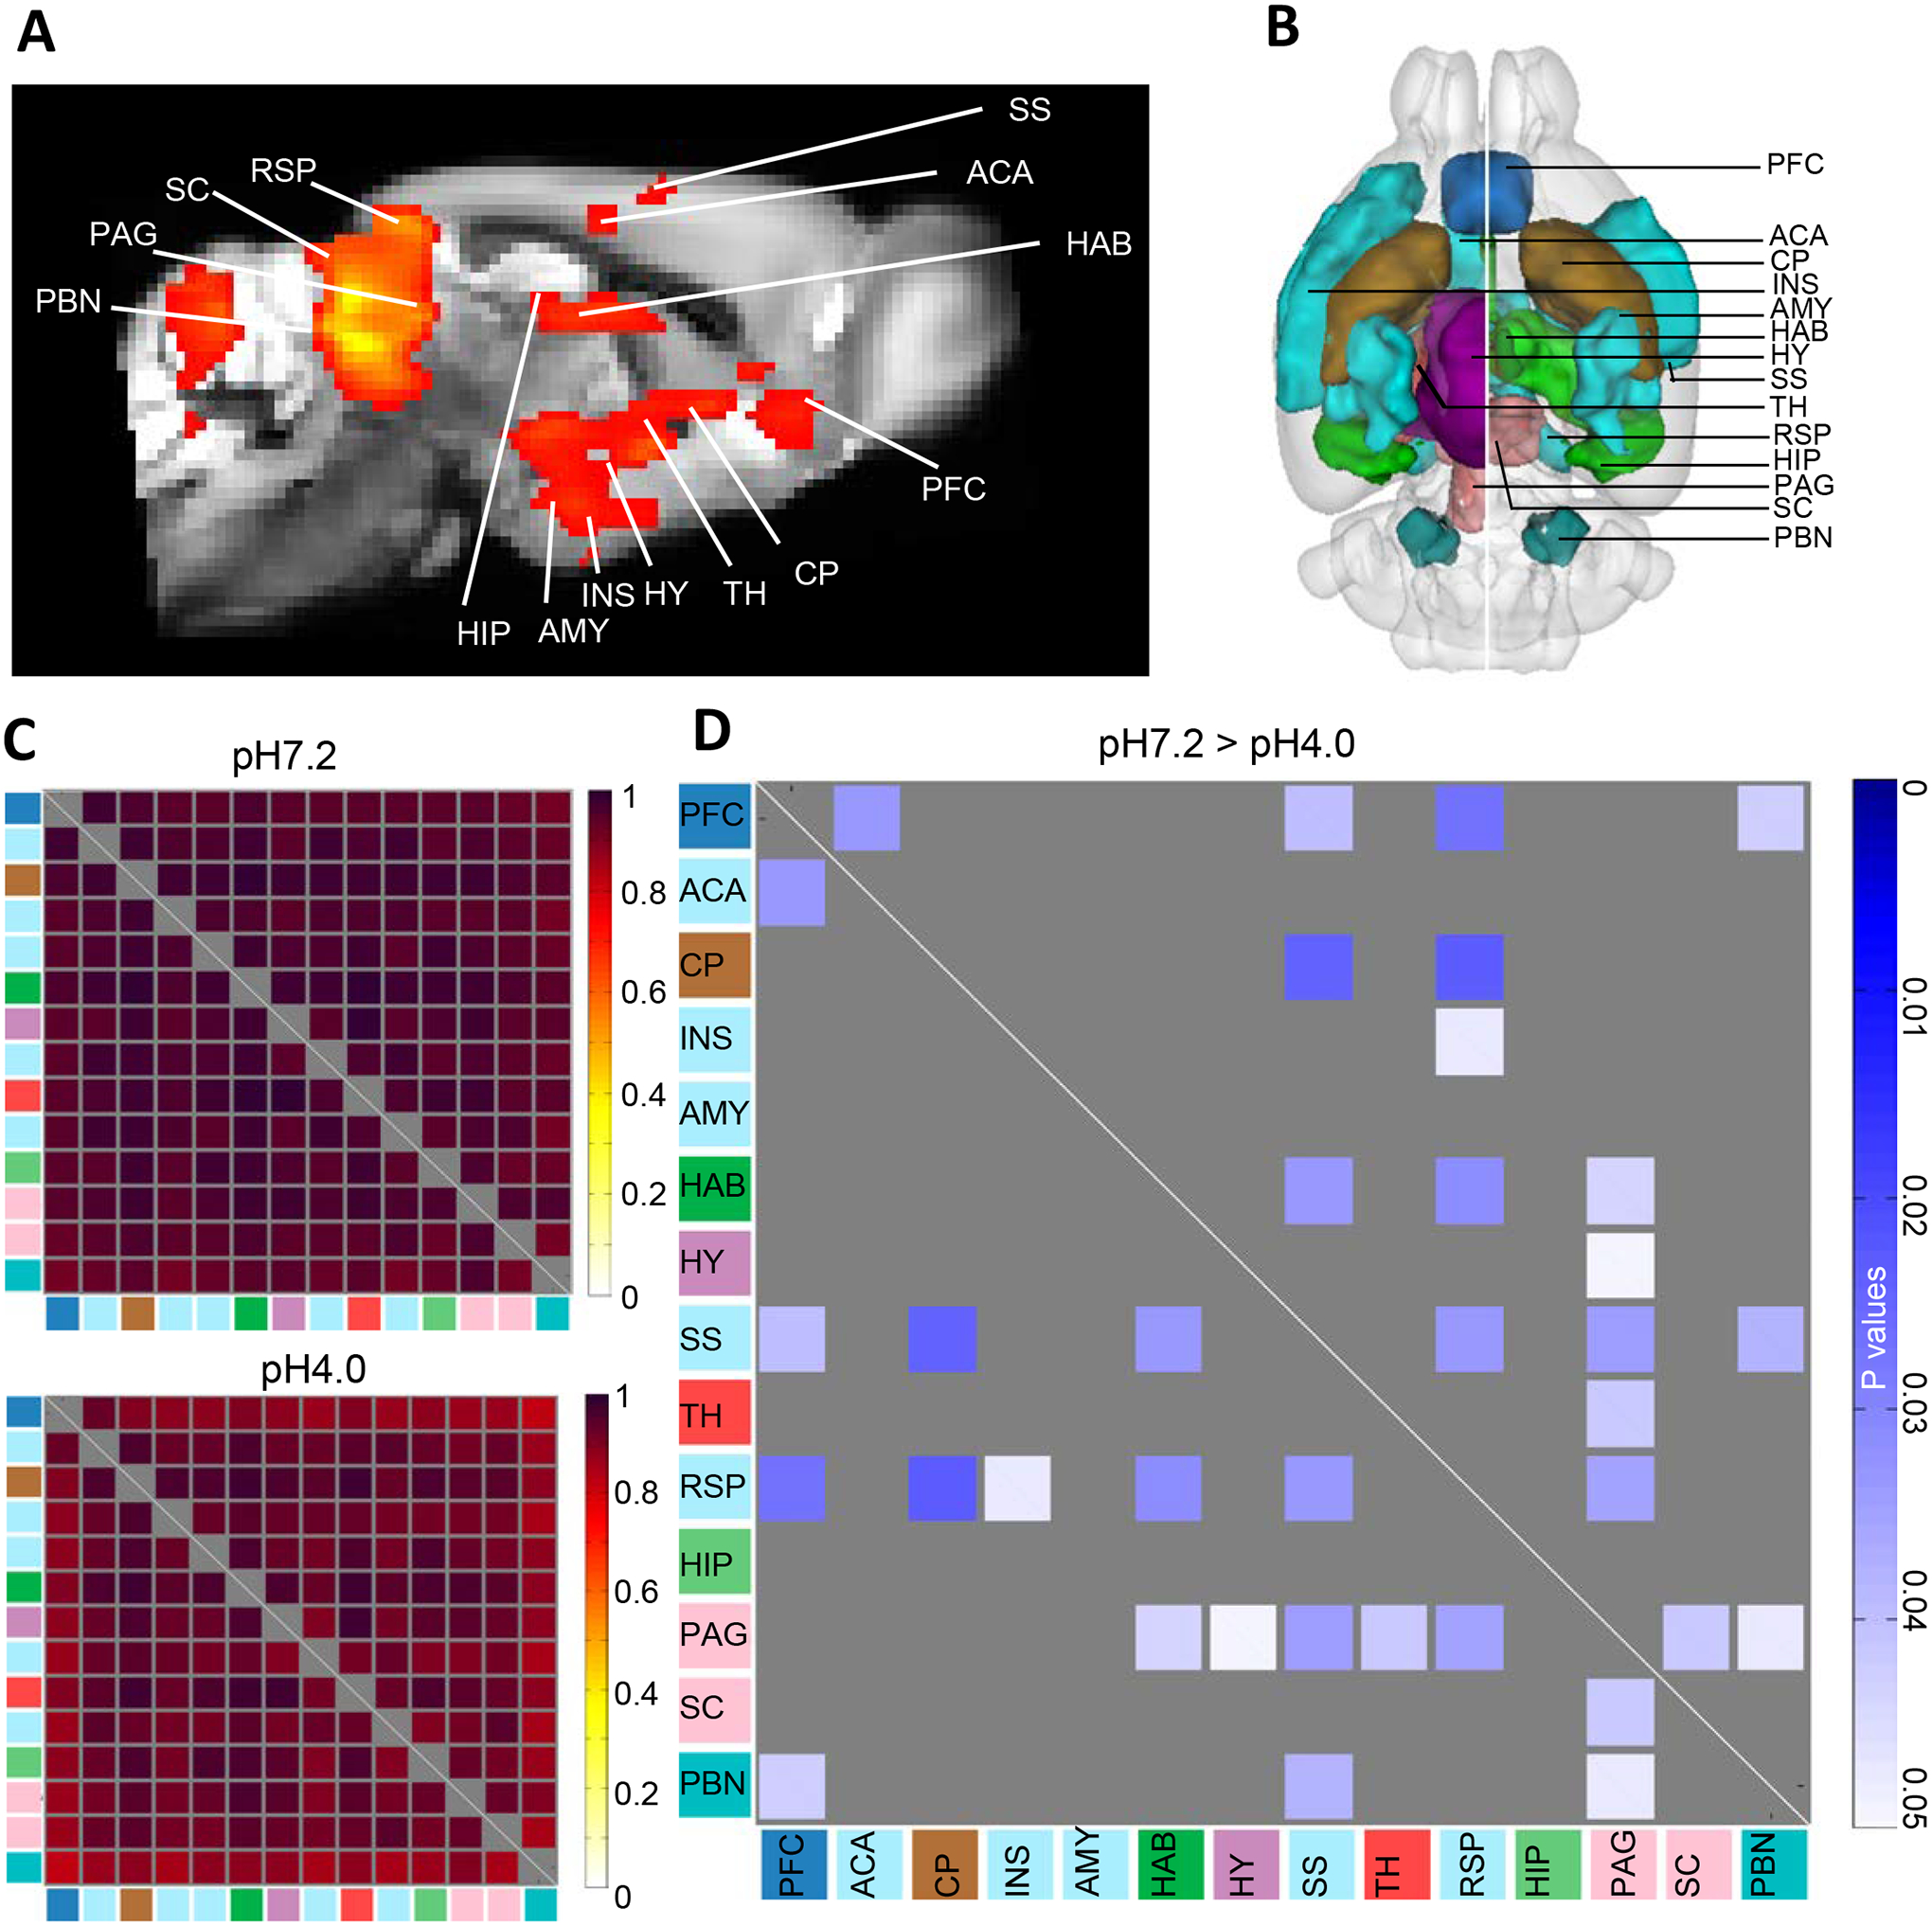
Fig. 2. Seed-to-seed FC analysis across pain-related areas.

(A) Low component ICA identifies a pain network in the pH7.2 group, which was used to construct a seed-based pain cluster; (B) 3D illustration of the 14 generated pain-related seeds based upon the mouse the Allen Brain Connectivity Atlas 2011; (C) Mean correlation coefficients for pH7.2 (top) and pH4.0 (bottom) groups; (D) The group comparison matrix shows p values using t-test (P<0.05, n=10, one tail, FDR correction), and identifies significant lower seed-to-seed FC in the FM group (pH7.2 > pH4.0). Color code used for seed annotation is identical to Fig. 1A. The color bar (right) indicates significant p-value scaling. Prefrontal cortex (PFC); Anterior cingulate area (ACA); Caudate putamen (CP); Insular cortex (INS); Amygdala (AMY); Habenula (HAB); Hypothalamus (HY); Somatosensory cortex (SS); Thalamus (TH); Retrosplenial cortex (RSP); Hippocampus (HIP); Periaqueductal gray (PAG); Superior colliculus (SC); Parabrachial nucleus (PB).
