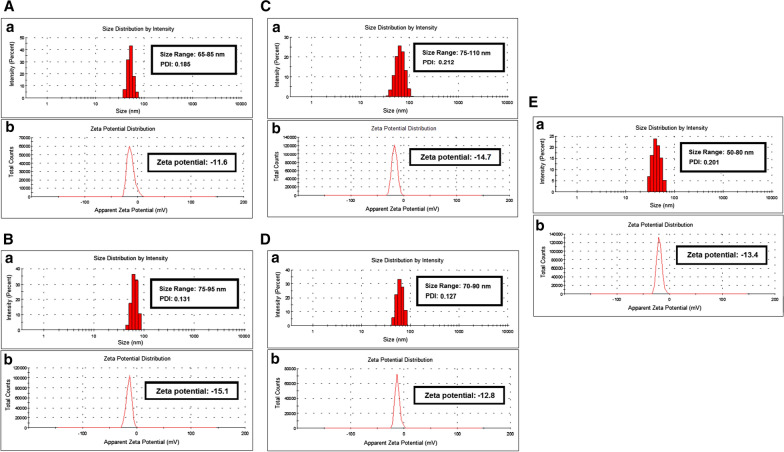
Fig. 3.
Illustrating the average particle size distribution histogram and zeta potential of ZnO nanoparticle, the reducing/capping agent and various drugs used in the study where A showing particle size (a) and zeta potential graph (b) of quercetin loaded beta-cyclodextrin capped ZnO NPs (QT-ZnO-BCD NPs), B showing particle size distribution histogram (a) and zeta potential graph (b) of naringin loaded beta-cyclodextrin capped ZnO NPs (NAR-ZnO-BCD NPs), C display average particle size distribution histogram (a) and zeta potential graph (b) of ceftriaxone loaded beta-cyclodextrin capped ZnO NPs (CFT-ZnO-BCD NPs), D display particle size distribution histogram (a) and zeta potential graph (b) of ampicillin loaded beta-cyclodextrin capped ZnO nanoparticles (AMP-ZnO-BCD NPs) and E showing particle size distribution histogram (a) and zeta potential graph (b) of amphotericin B loaded beta-cyclodextrin capped ZnO nanoparticles (AMB-ZnO-BCD NPs)

