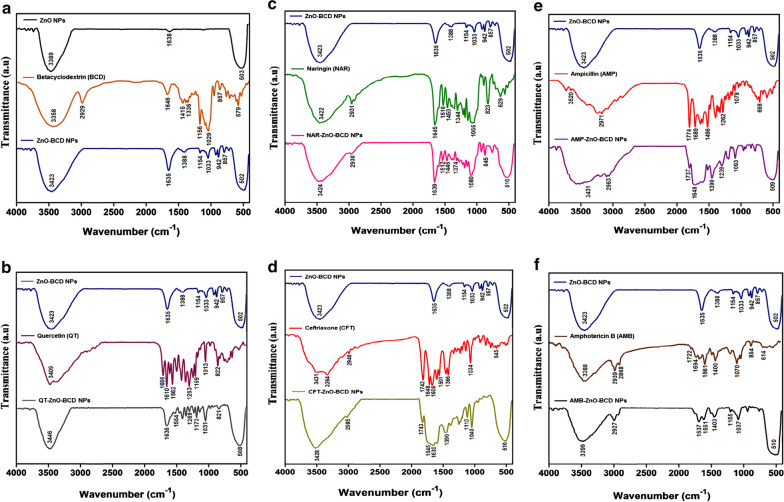
Fig. 4.
a FT-IR spectra of ZnO-NPs alone is compared with BCD and BCD-ZnO-NPs complex, b relative FT-IR analysis of (ZnO-BCD NPs), quercetin (QT) and (QT-ZnO-BCD NPs), c comparative FTIR analysis of (ZnO-BCD NPs), naringin (NAR) and (NAR-ZnO-BCD NPs), d FTIR analysis of (ZnO-BCD NPs), ceftriaxone (CFT) and (CFT-ZnO-BCD NPs), e FTIR analysis of (ZnO-BCD NPs), ampicillin (AMP) and (AMP-ZnO-BCD NPs) and f FTIR analysis of (ZnO-BCD NPs), amphotericin B (AMB) and (AMB-ZnO-BCD NPs). All the spectra were acquired by employing IR-470 spectrometer (Shimadzu, Kyoto, Japan)

