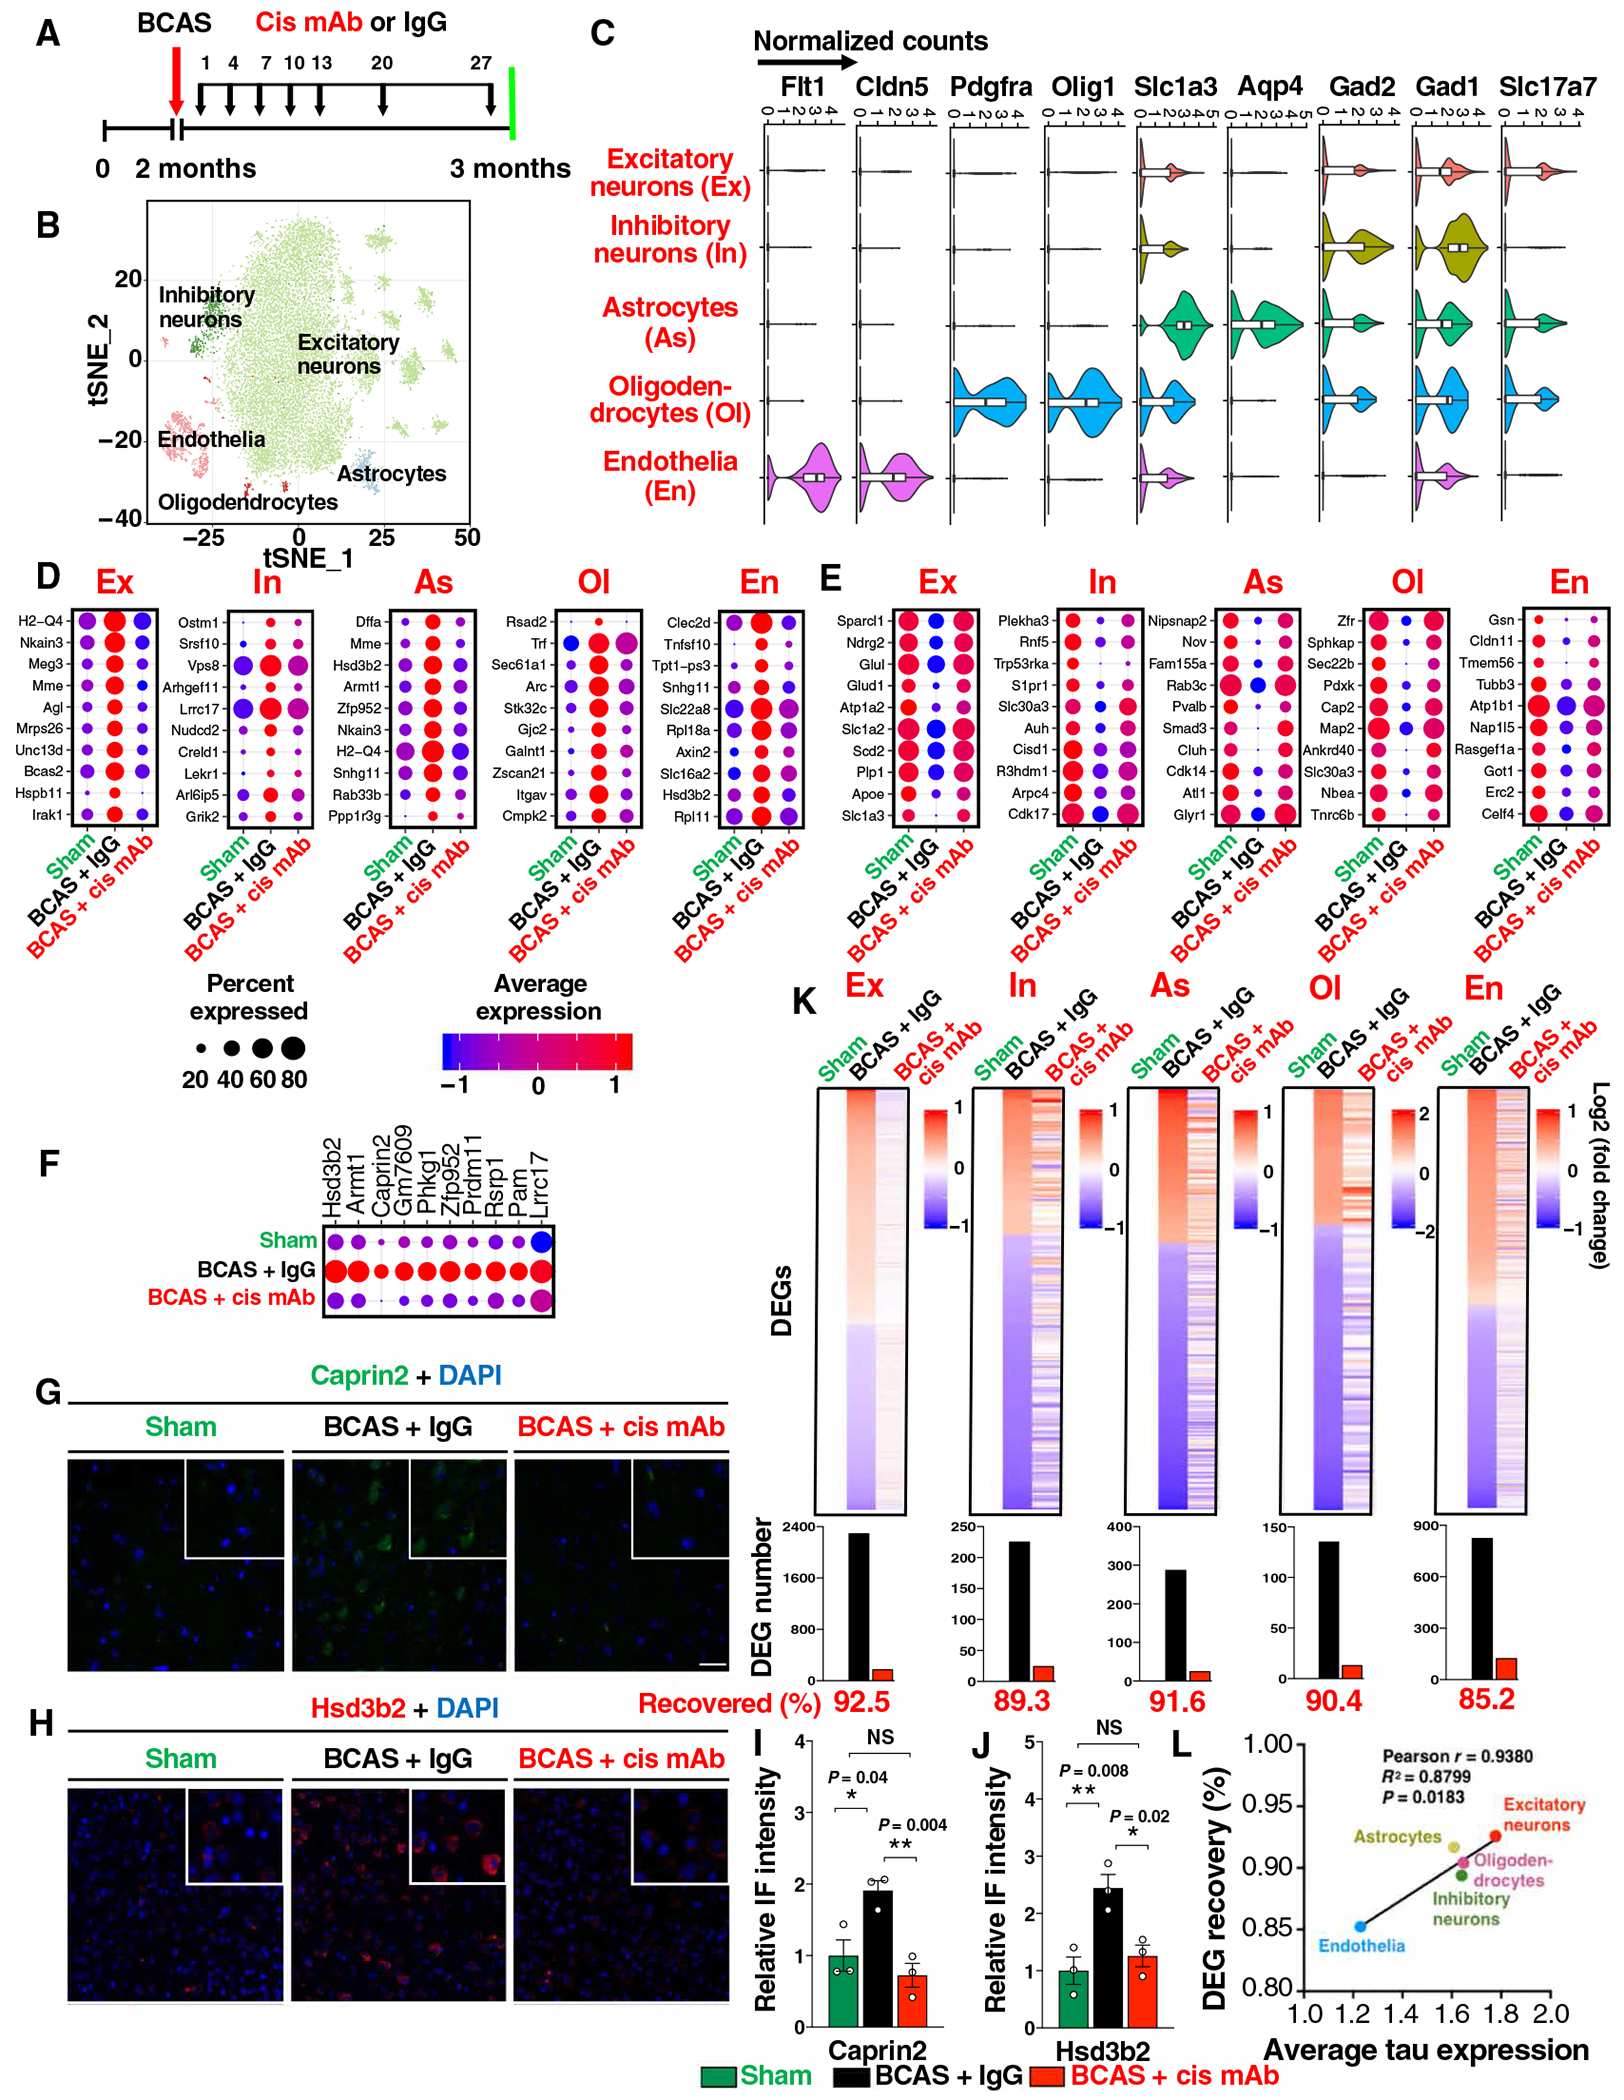
Fig. 5. BCAS induces diverse cortical cell type–specific transcriptomic changes, and the vast majority of the global alterations are recovered by cis mAb.

(A) Experimental setup of the single-nucleus RNA-seq for BCAS mice treated with IgG or cis mAb, with sham littermate as controls. (B) tSNE (t-distributed stochastic neighbor embedding) plots of color-coded cortical cell types. (C) Normalized expression of marker genes for different cell types: Slc17a7 (glutamatergic neurons, Ex), Gad1 and Gad2 (GABAergic neurons, In), Aqp4 and Slc1a3 (astrocytes, As), Olig1 and Pdgfra (oligodendrocytes and their progenitor cells, Ol), and Cldn5 and Flt1 (endothelia, En). (D to F) Top up-regulated (D) or down-regulated DEGs (E) in different cell types in BCAS mice with or without cis mAb treatment, and a list of up-regulated excitatory neuronal DEGs that have not been clearly linked to neurodegeneration or stroke (F). Dot plots are color coded with average expression and sized with percentage of cells expressing the gene. (G to J) Validation of two DEGs Caprin2 (G and I) and Hsd3b2 (H and J) with IF staining (G and H), with quantitations (I and H). The data in (I) and (J) were presented as means ± SEM, and the P values were calculated using one-way ANOVA with post hoc Dunnett’s multiple comparison test. (K) Top: Log2-transformed relative normalized expression of each gene compared to sham. Cell types are labeled on the top. Bottom: Number of DEGs are shown in bar graphs. Genes that are differentially expressed in BCAS + IgG but not in BCAS + cis mAb mice (referencing to sham mice) are defined as recovered genes. (L) Xyplot showing correlation between average tau expression and the recovered DEG percentage in five major cell types.
