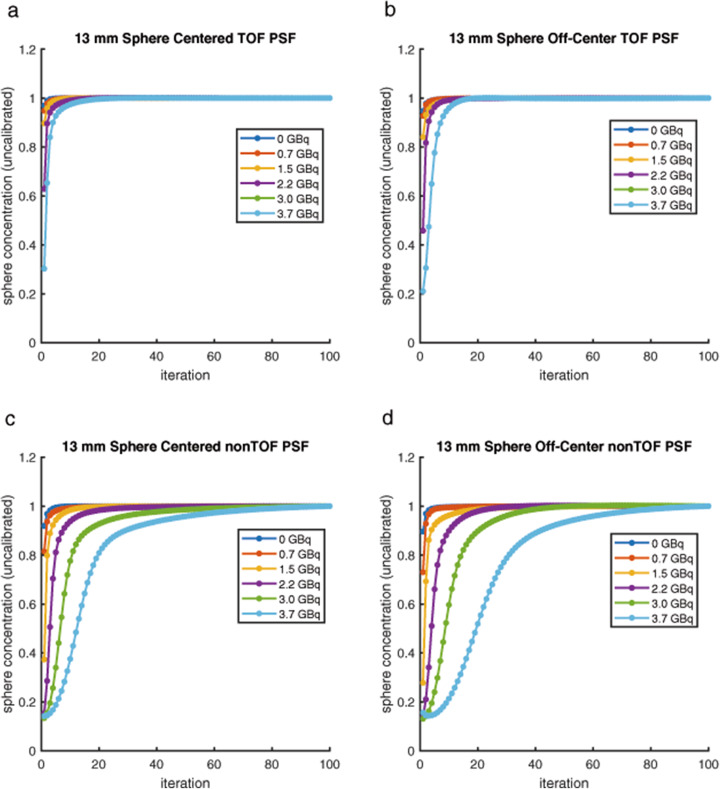
Fig. 5.
Normalized mean 124I concentration measured on the PET image, in a small (3 × 3 × 3 voxel) VOI at the approximate center of the 13-mm-diameter sphere for the centered phantom reconstructed with TOF information (a), for the off-center phantom reconstructed with TOF information (b), for the centered phantom reconstructed without TOF information (c), and for the off-center phantom reconstructed without TOF information (d) all shown as a function of the number of iterations. This measurement was done for scans acquired with 0, 0.75, 1.45, 2.23, 2.99, and 3.76 GBq of 131I in the background. Each curve has been normalized to the concentration seen after 100 iterations

