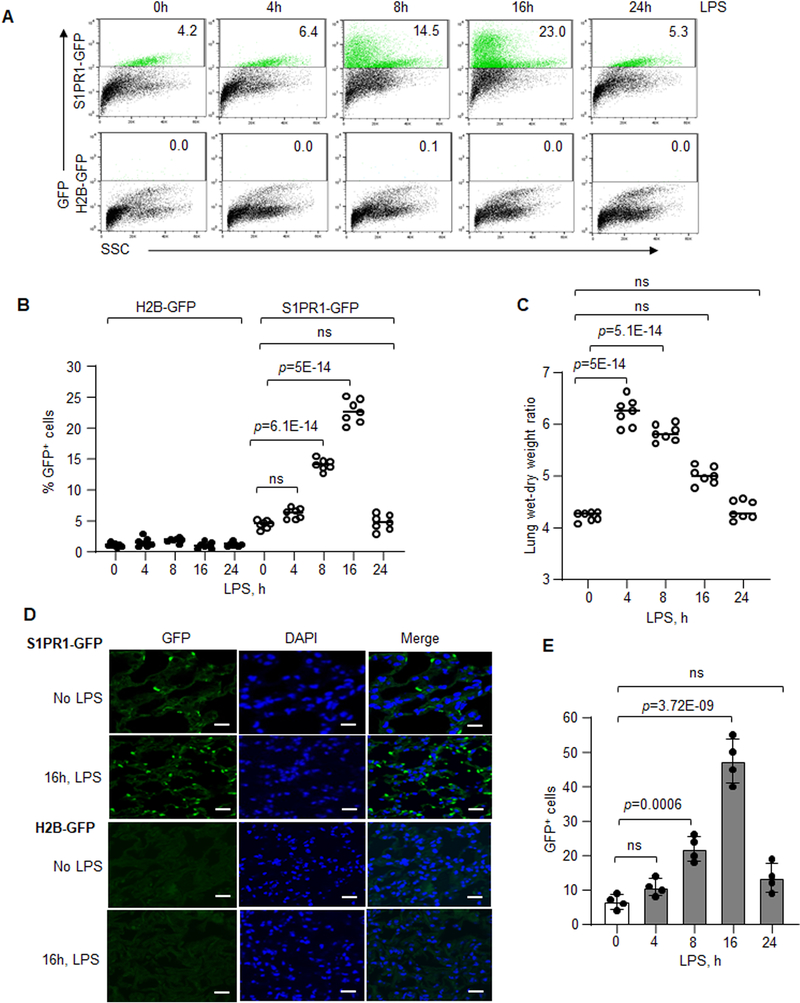
Figure 2: Kinetics of S1PR1 activity following LPS-induced lung vascular injury.
A and B, FACS analysis of lung cell suspension obtained from S1PR1-GFP reporter mice or H2B-GFP (control) mice following LPS (10 mg/kg, i.p.) administration. A, scatter dot plot of GFP gated cells. B, quantification of GFP+ cells as percent of total lung cells at each time (n=7 mice/group). C, LPS-induced (10 mg/kg i.p.) vascular injury in S1PR1-GFP reporter mice was determined by measuring lung wet-dry weight ratio (n=7 mice/group). D, a representative micrograph of GFP+ cells in the lung sections from S1PR1-GFP reporter or H2B-GFP mice 16h post LPS challenge. E, quantification of GFP+ cells from multiple lung sections. Scale bar 50 μm (n=4 mice/group). B, C and E show individual scatter with mean ±SD. Statistical significance was assessed by one-way ANOVA followed by Post hoc Tukey’s multiple comparisons test for B, C and E (See also Online Table II). B, p=5E-14, p=6.1E-14; C, p=5.1E-14, p=5E-14; E, p=3.72E-09 and p=0.0006 indicate significance relative to 0h LPS. ns=not significant.

