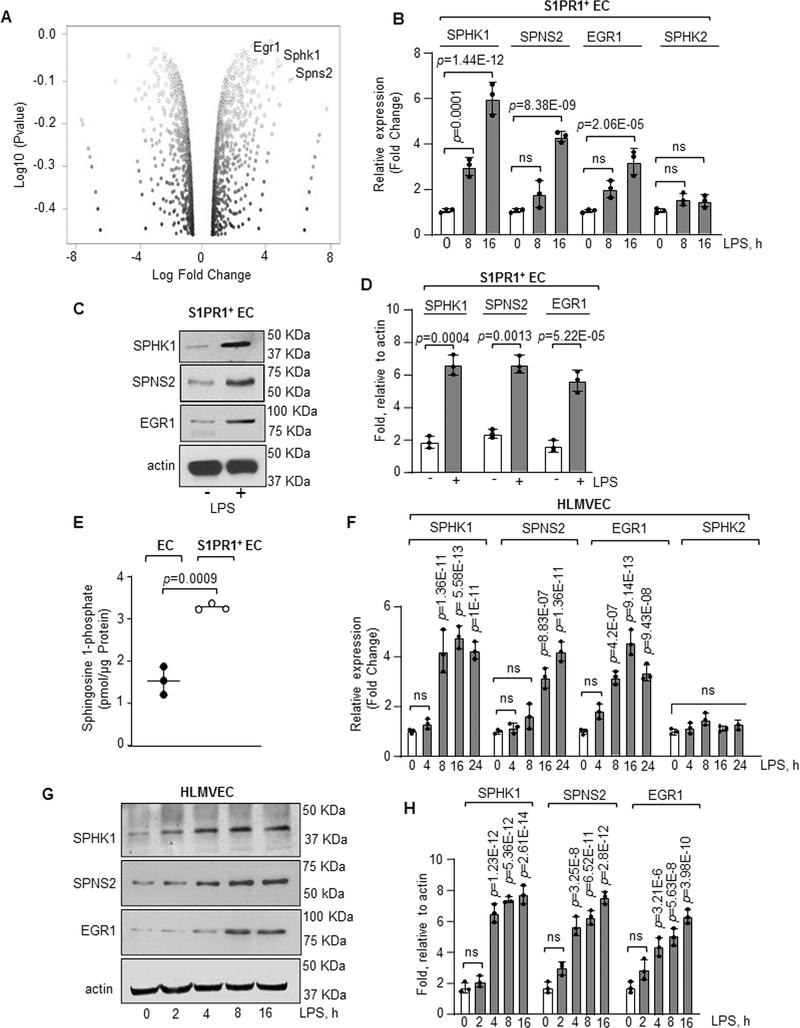
Figure 4: RNA-seq analysis of S1PR1+ endothelial cells.
A, S1PR1+ EC were flow sorted from unexposed or LPS administered (10 mg/kg, i.p) S1PR1-GFP reporter mice at indicated time points and RNA-seq analysis was performed. A, volcano plot of genes in S1PR1+ EC at 16h post LPS challenge versus 0h. B, validation of indicated gene expression in S1PR1+ EC taking GAPDH as an internal control (n=3). Gene expression is shown as fold change relative to respective genes at 0h LPS. C-D, A Representative immunoblot shows SPHK1, SPNS2 and EGR1 protein expression in flow sorted S1PR1+ EC post 16h LPS stimulation, while plot shows densitometric analysis of indicated proteins expressed as fold increase over actin (n=3). E, S1P concentration was quantified using liquid chromatography-mass spectrometry in S1PR1+ EC versus non-GFP EC flow sorted at 16h post LPS exposure (n=3 mice/group). F, qPCR analysis of indicated genes in HLMVEC after with or without 1μg/ml LPS stimulation from three different experiments. GAPDH was used as an internal control. Gene expression is shown as fold change relative to 0h LPS. G-H, A representative immunoblot shows SPHK1, SPNS2 and EGR1 expression in HLMVEC after stimulation with LPS (1μg/ml) and corresponding densitometry of indicated proteins expressed as fold increase over actin (n=3). B, D, E, F and H show individual data along with mean ±SD. Data in B, F, and H were analyzed using one-way ANOVA followed by Post hoc Tukey’s multiple comparisons test. Unpaired t test was used in D and E (See also Online Table II). C, p=0.0001, p=1.44E-12, p=8.38E-09, p=2.06E-05 indicate significance relative to 0h LPS; D, p=0.0004, p=0.0013, p=5.2E-05 indicate significance relative to No LPS; E, p=0.0009 indicate significance relative to EC; F, p=1.36E-11, p=5.58E-13, p=1E-11 (SPHK1); p=8.83E-07, p=1.36E-11 (SPNS2); p=4.2E-07, p=9.14E-13, p=9.43E-08 (EGR1) indicate significance relative to 0h LPS; H, p=1.23E-12, p=5.36E-12, p=2.61E-14 (SPHK1); p=3.25E-8, p=6.52E-11, p=2.8E-12 (SPNS2); p=3.21E-6, p=5.63E-8 and p=3.98E-10 (EGR1) indicate significance relative to 0h LPS. ns=not significant.

