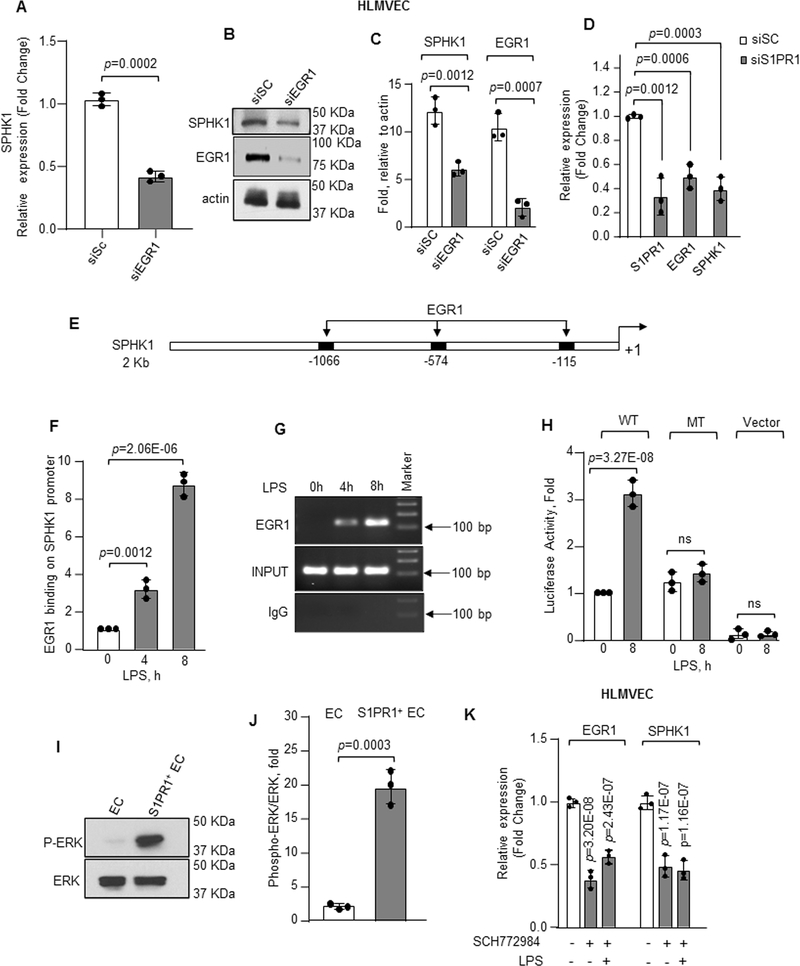
Figure 5: EGR1 induces transcription and expression downstream of S1PR1.
A–C, SPHK1 mRNA (A) or protein expression (B–C) following EGR1 depletion in HLMVEC quantified as described in Figure 4B and 4D (n=3). GAPDH was used to normalize RNA while actin was used as loading control for quantifying protein expression. mRNA level quantified as fold change relative to cells transfected with scrambled siRNA. D, mRNA expression of S1PR1, EGR1 and SPHK1 in control versus S1PR1-depleted HLMVEC was quantified taking GAPDH as internal control (n=3). mRNA level quantified as fold change relative to cells transfected with scrambled siRNA. E, human SPHK1 promoter region with three EGR1 binding sites. F, HLMVEC were stimulated with LPS (1μg/ml) for indicated times and chromatin immunoprecipitation (ChIP) followed by qPCR was performed to amplify EGR1 binding sites in SPHK1 promoter (n=3). G, a representative gel shows qPCR-amplified product. H, HLMVEC transducing wild type (WT) or mutated (MT) SPHK1 luciferase promoter constructs were stimulated with LPS (1μg/ml) for indicated times. SPHK1 promoter activity was determined as described in online methods (n=3). I–J, a representative immunoblot shows ERK phosphorylation in flow sorted S1PR1+ EC versus non-GFP EC 16h post LPS stimulation of S1PR1-GFP reporter mice (n=3), whereas plot shows densitometry of phosphorylated ERK expressed as fold increase over total ERK. K, mRNA level of EGR1 and SPHK1 in HLMVEC stimulated with LPS (1μg/ml) and with/without specific ERK inhibitor (5μM) (n=3). mRNA level quantified as fold change relative to unstimulated cells. A, C, D, F, H, J and K show individual value along with mean ±SD. Data in plots F, H, and K were analyzed using one-way ANOVA followed by Post hoc Tukey’s multiple comparisons test, whereas unpaired t test was used for A, C, D, and J (See also Online Table II). A, p=0.0002; C, p=0.0012, p=0.0007; D, p=0.0012, p=0.0006, p=0.0003 indicate significance relative to siSC; F, p=0.0012, p=2.06E-06; H, p=3.27E-08 indicate significance relative to 0h LPS; J, p=0.0003 indicate significance relative to EC; K, p=3.20E-08, p=2.43E-07 (EGR1); p=1.17E-07 and p=1.16E-07 (SPHK1) indicate significance relative to No LPS. ns=not significant.

