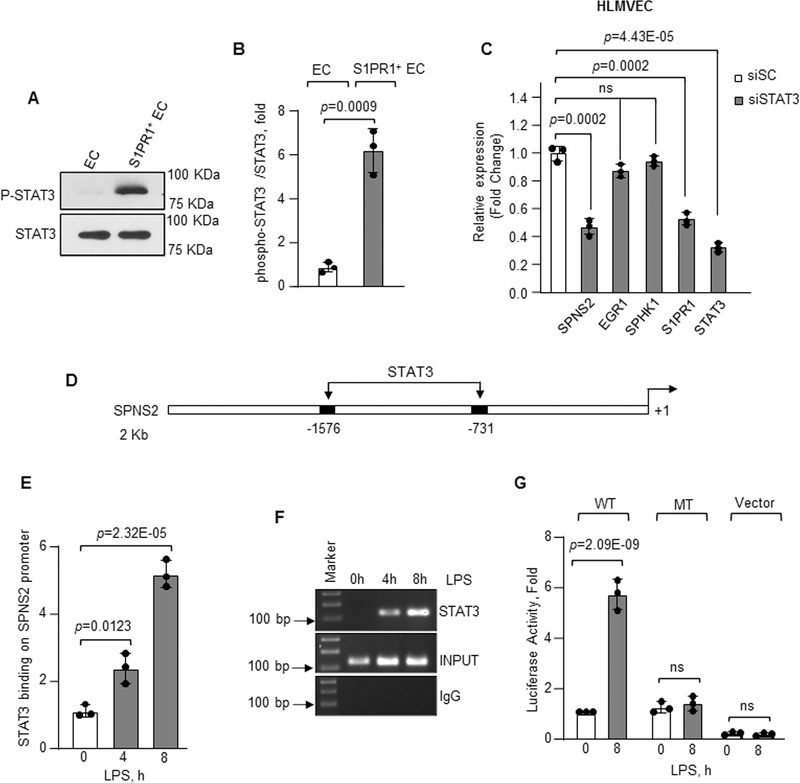
Figure 6: STAT3 induces transcription and expression of SPNS2.
A–B, phosphorylation of STAT3 (P-STAT3) from flow sorted EC or S1PR1+ EC (n=3). A, a representative immunoblot. B, densitometry of P-STAT3 expressed as fold increase over total STAT3. C, expression of indicated genes in STAT3 depleted HLMVEC was determined after LPS exposure (1μg/ml) using GAPDH as an internal standard (n=3). mRNA level was quantified as fold change relative to cells transfected with scrambled siRNA. D, human SPNS2 promoter region with two STAT3 binding sites. E–F, binding enrichment of STAT3 on SPNS2 promoter was determined by ChIP assay following without or with LPS stimulation (1μg/ml) as described in Figure 5F and 5G (n=3). G, SPNS2 promoter activity in HLMVEC transfected with wild type (WT) or mutated (MT) SPNS2 promoter constructs after with or without LPS (1μg/ml) stimulation (n=3). B, C, E and G show individual values along with mean ±SD. Data in E and G were analyzed using one-way ANOVA followed by Tukey’s multiple comparisons test, while unpaired t test was used for B and C (See also Online Table II). B, p=0.0009 indicates significance relative to EC; C, p=0.0002, p=0.0002 and p=4.43E-05 indicate significance relative to siSC; E, p=0.0123, p=2.32E-05 and G, p=2.09E-09 indicate significance relative to 0h LPS. ns=not significant.

