
Figure 4:
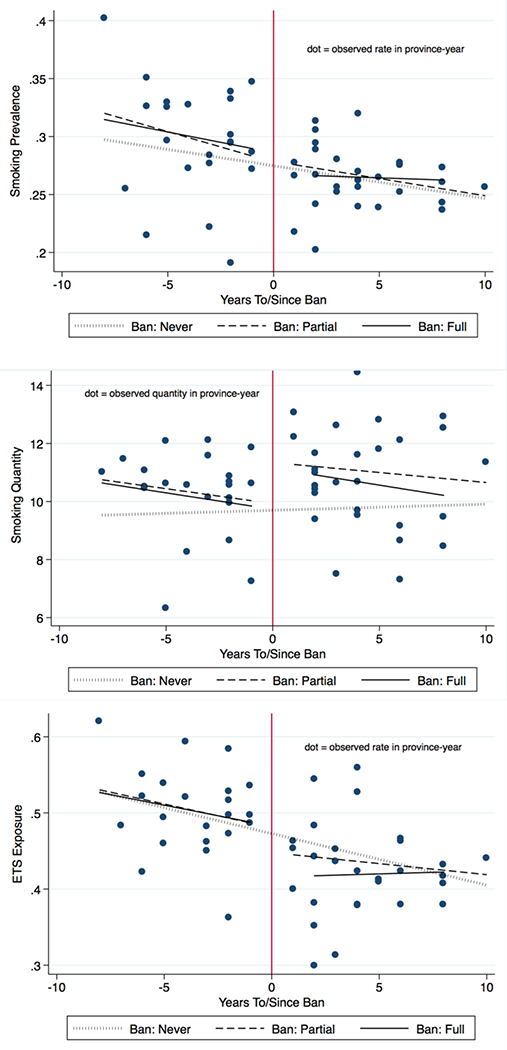
Event Study Analyses, of smoking prevalence and quantity
Note: The top graph depicts the results of an event study analysis of smoking prevalence prior to and after (partial and full) ban implementation. The middle graph explores each ban’s effect on smoking quantities conditional on smoking, while the bottom graph shows these effects on ETS exposure.