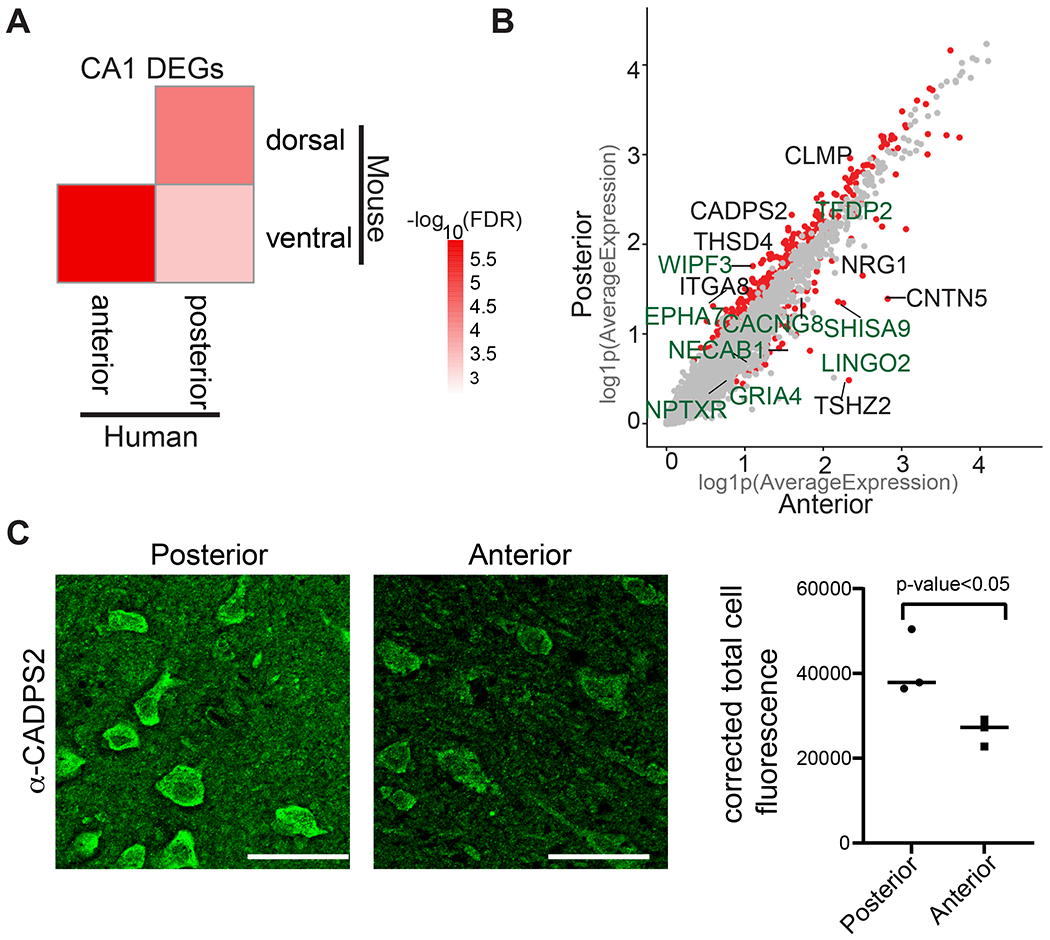
Figure 3. Differential gene expression in CA1 neurons in anterior and posterior hippocampus.

(A) Heatmap showing −log10(FDR) from a hypergeometric enrichment test for the overlaps between mouse CA1 dorsal-ventral enriched genes described in Cembrowski et al. (Cembrowski et al., 2016a) with human CA1 genes enriched in the anterior and posterior hippocampus. (B) Scatter plot showing log(1+x) (log1p) of the average expression for each gene in CA1 neurons in anterior (x-axis) and posterior (y-axis). Red dots represent the genes that are significantly differentially expressed across anterior CA1 vs posterior CA1 (adj. p-value<0.05, log2FC>0.3, percentage>25); gray dots represent the genes that are not differentially expressed. The names of genes that are differentially expressed both in mouse and human across the long axis are labeled green. The names of genes that are differentially expressed across the axis only in human are labeled black. (C) Immunohistochemistry demonstrates greater protein levels of CADPS2 in posterior compared to anterior hippocampus. Left panel: representative image of immunohistochemistry using α-CADPS2 in posterior or anterior hippocampal tissue. Right panel: quantification of corrected total cell fluorescence from immunohistochemistry using α-CADPS2 in posterior compared to anterior hippocampus. Individual points represent the average intensity values derived from each specimen (n=3, P< 0.05; unpaired t test). See also Figure S11 and Table S8, S9.
