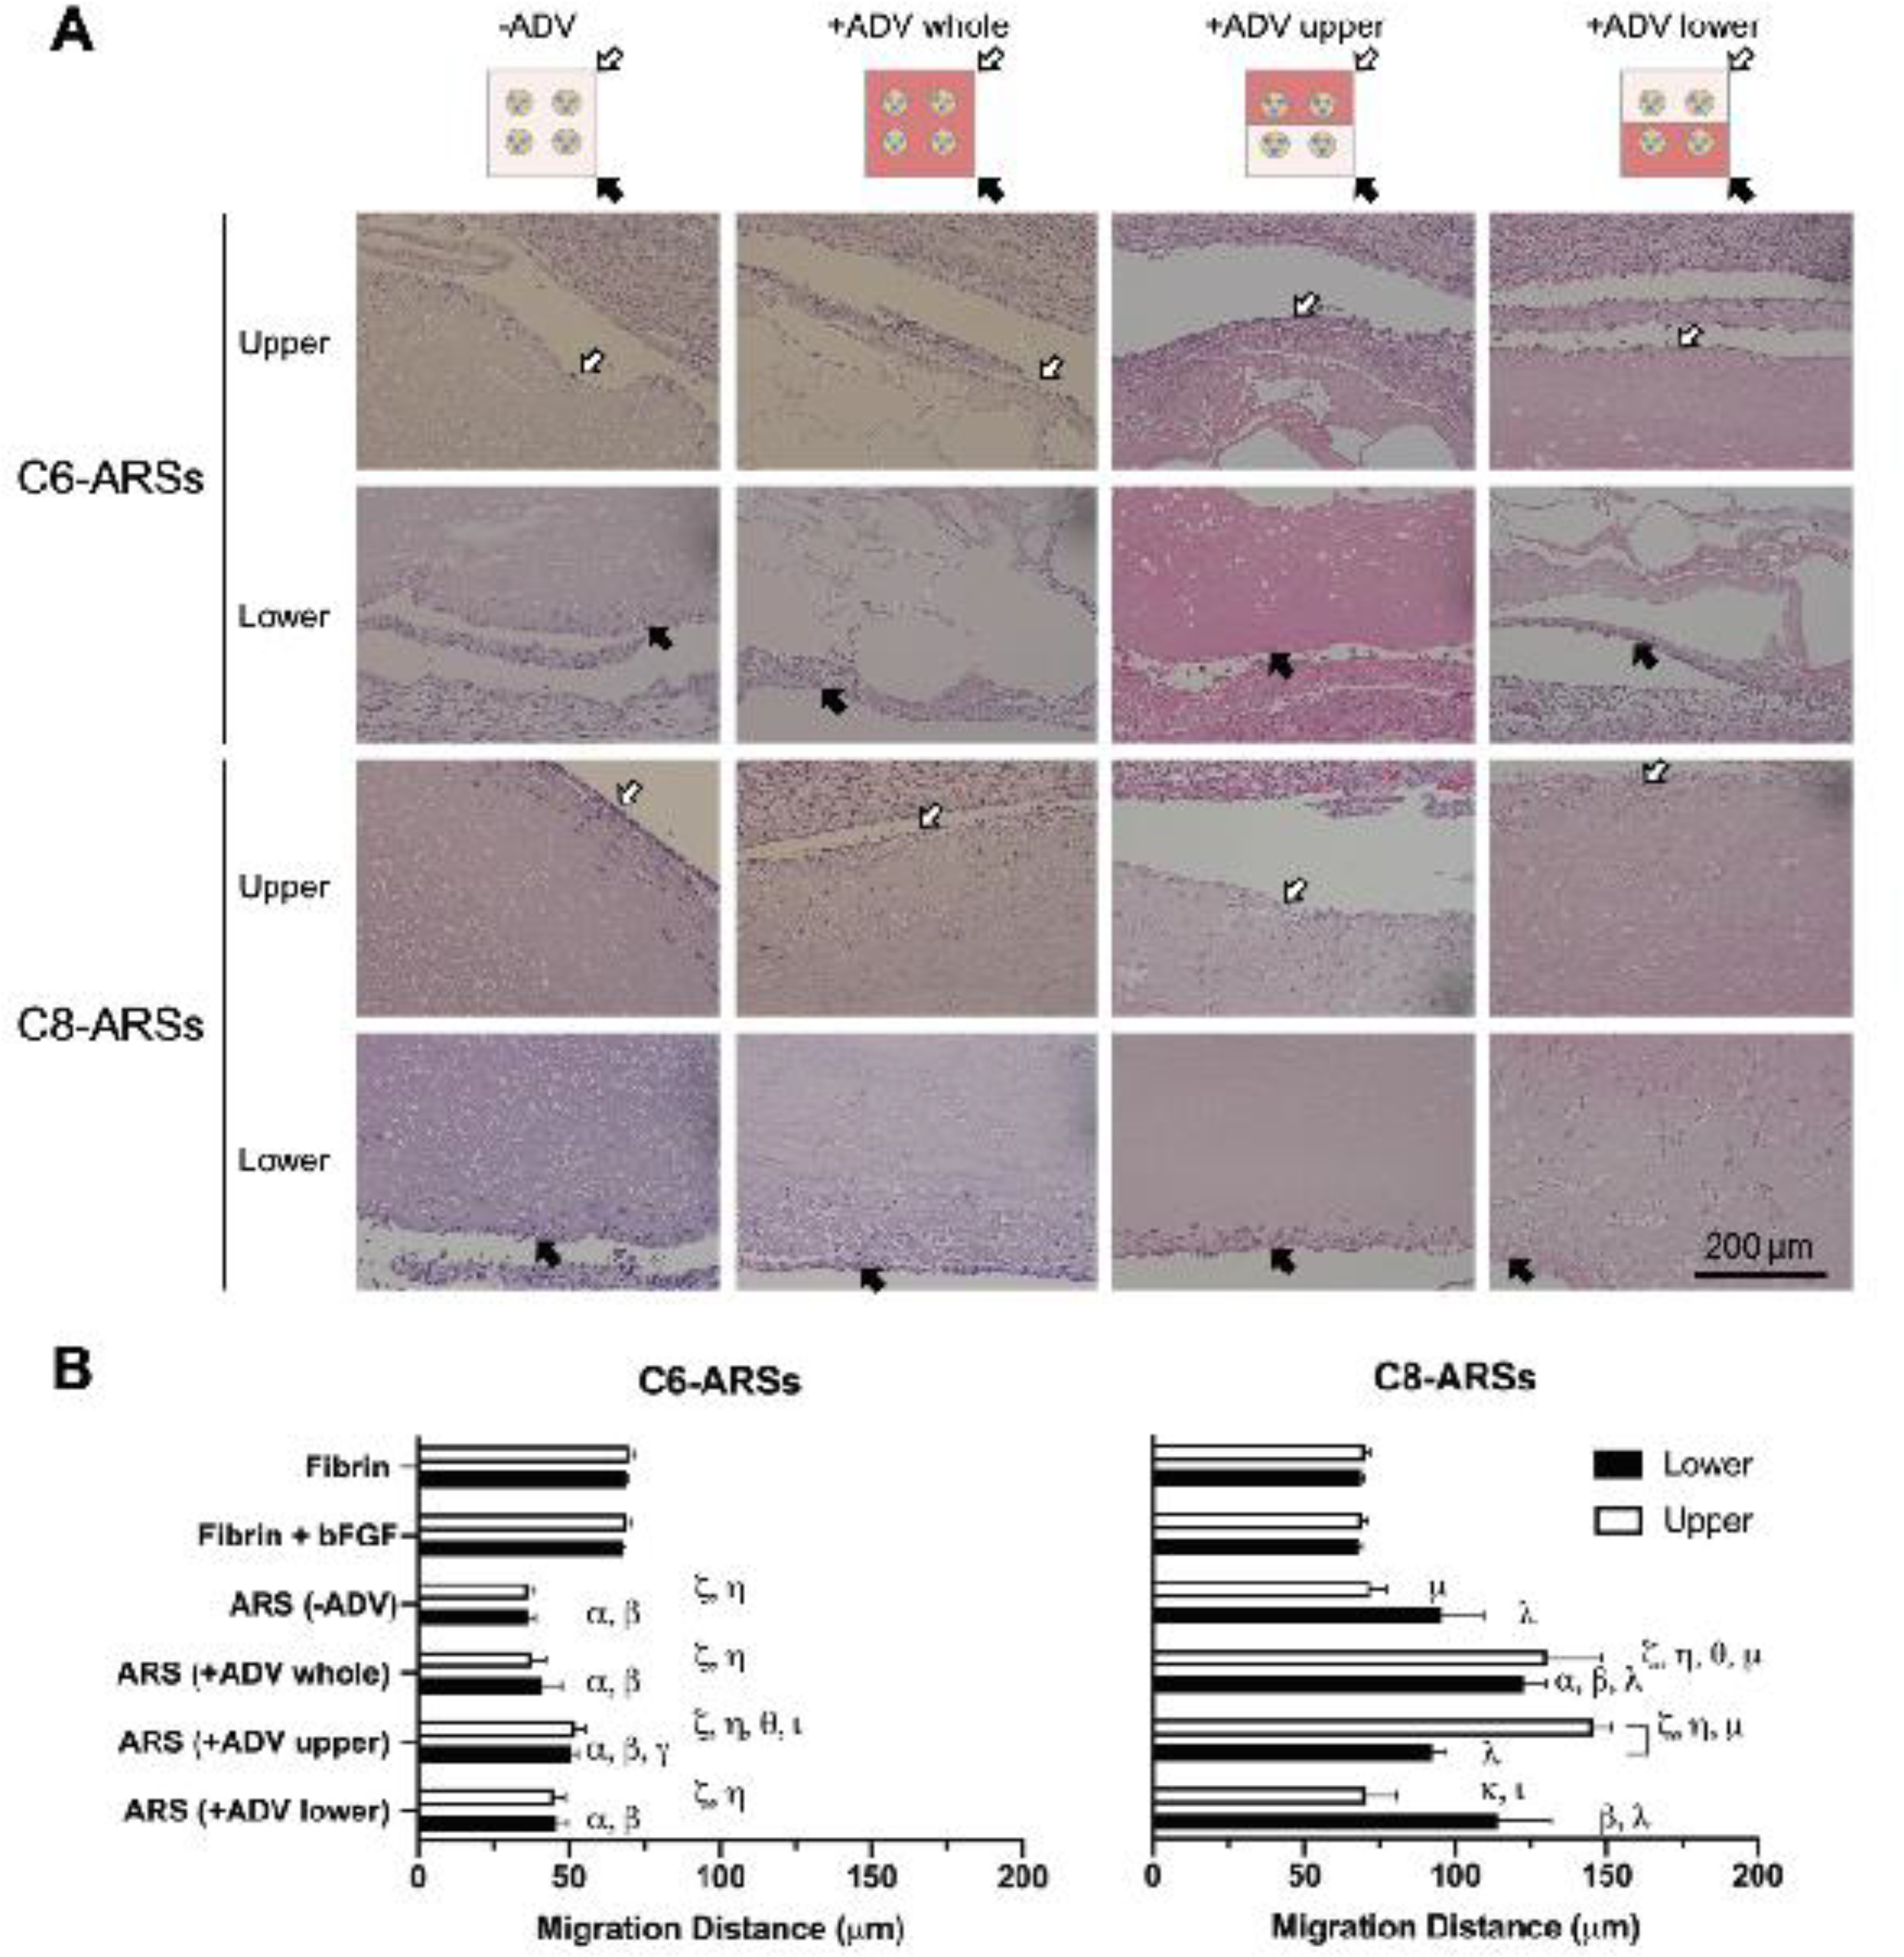
Figure 2.

The morphology of the ARS after ADV and extent of host cell migration into the ARS were dependent on the PFC species within the PSDE and pattern of ADV. A) H&E images of ARSs explanted after 14 days reveal stable bubbles in C6-ARSs whereas no stable bubbles were evident in C8-ARSs. Host cell migration was more evident in C8-ARSs. The white and black arrows denote the upper and lower interfaces of the ARSs proximal to the overlying skin and underlying muscle, respectively. Low magnification images are shown in Supplemental Figure 2. B) The migration distance of host cells into the upper and lower regions of the implanted scaffolds was quantified based on the H&E images. Data are represented as mean ± standard error of the mean (N=5 per group). Significant differences (p < 0.05) are denoted by brackets and Greek letters, which are defined in section 2.7.
