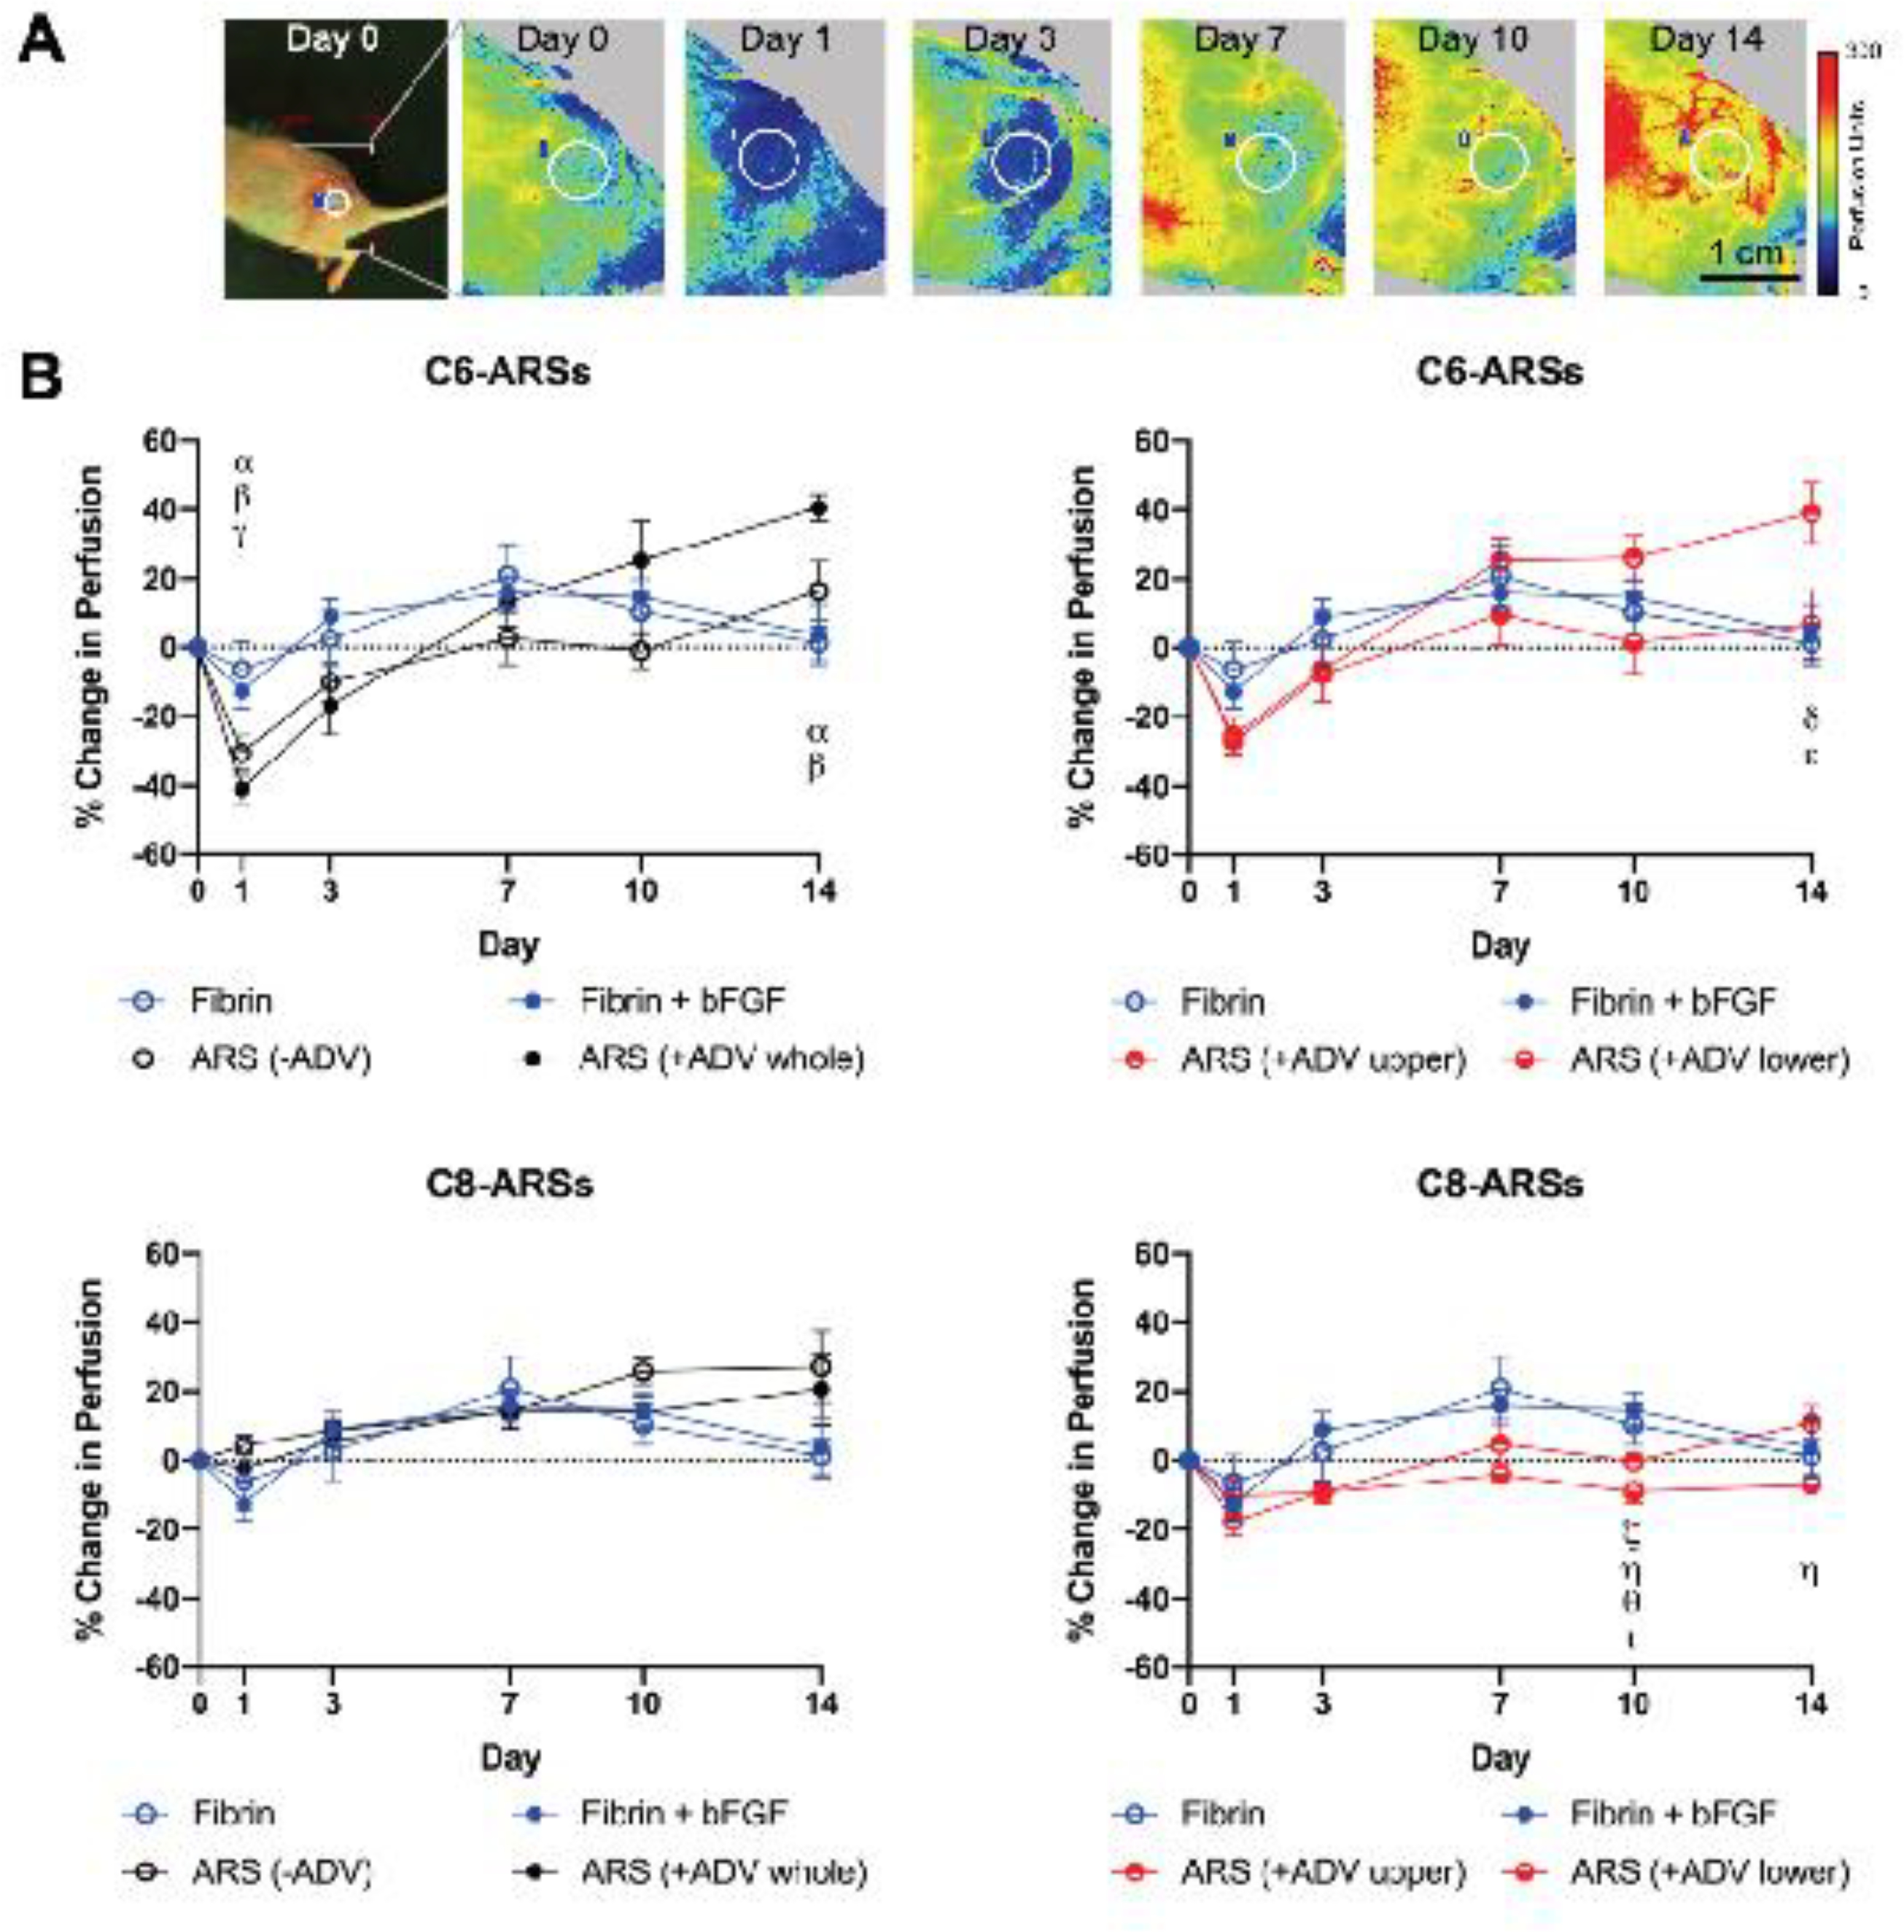
Figure 6.

Laser speckle contrast analysis (LASCA) imaging was used to monitor perfusion in the implant region. A) Longitudinal images display an implanted C6-ARS (+ADV whole) within a mouse, which was imaged in a lateral recumbent position. The white circle denotes the region of interest (ROI) that was used for quantitative analysis. B) The change in perfusion was quantified by calculating the average perfusion within an ROI at a given day and then comparing it to the average perfusion on day 0. Data are represented as mean ± standard error of the mean (N=5 per group). Significant differences (p < 0.05) are denoted by Greek letters, which are defined in section 2.7.
