
Figure 3. Site 2.
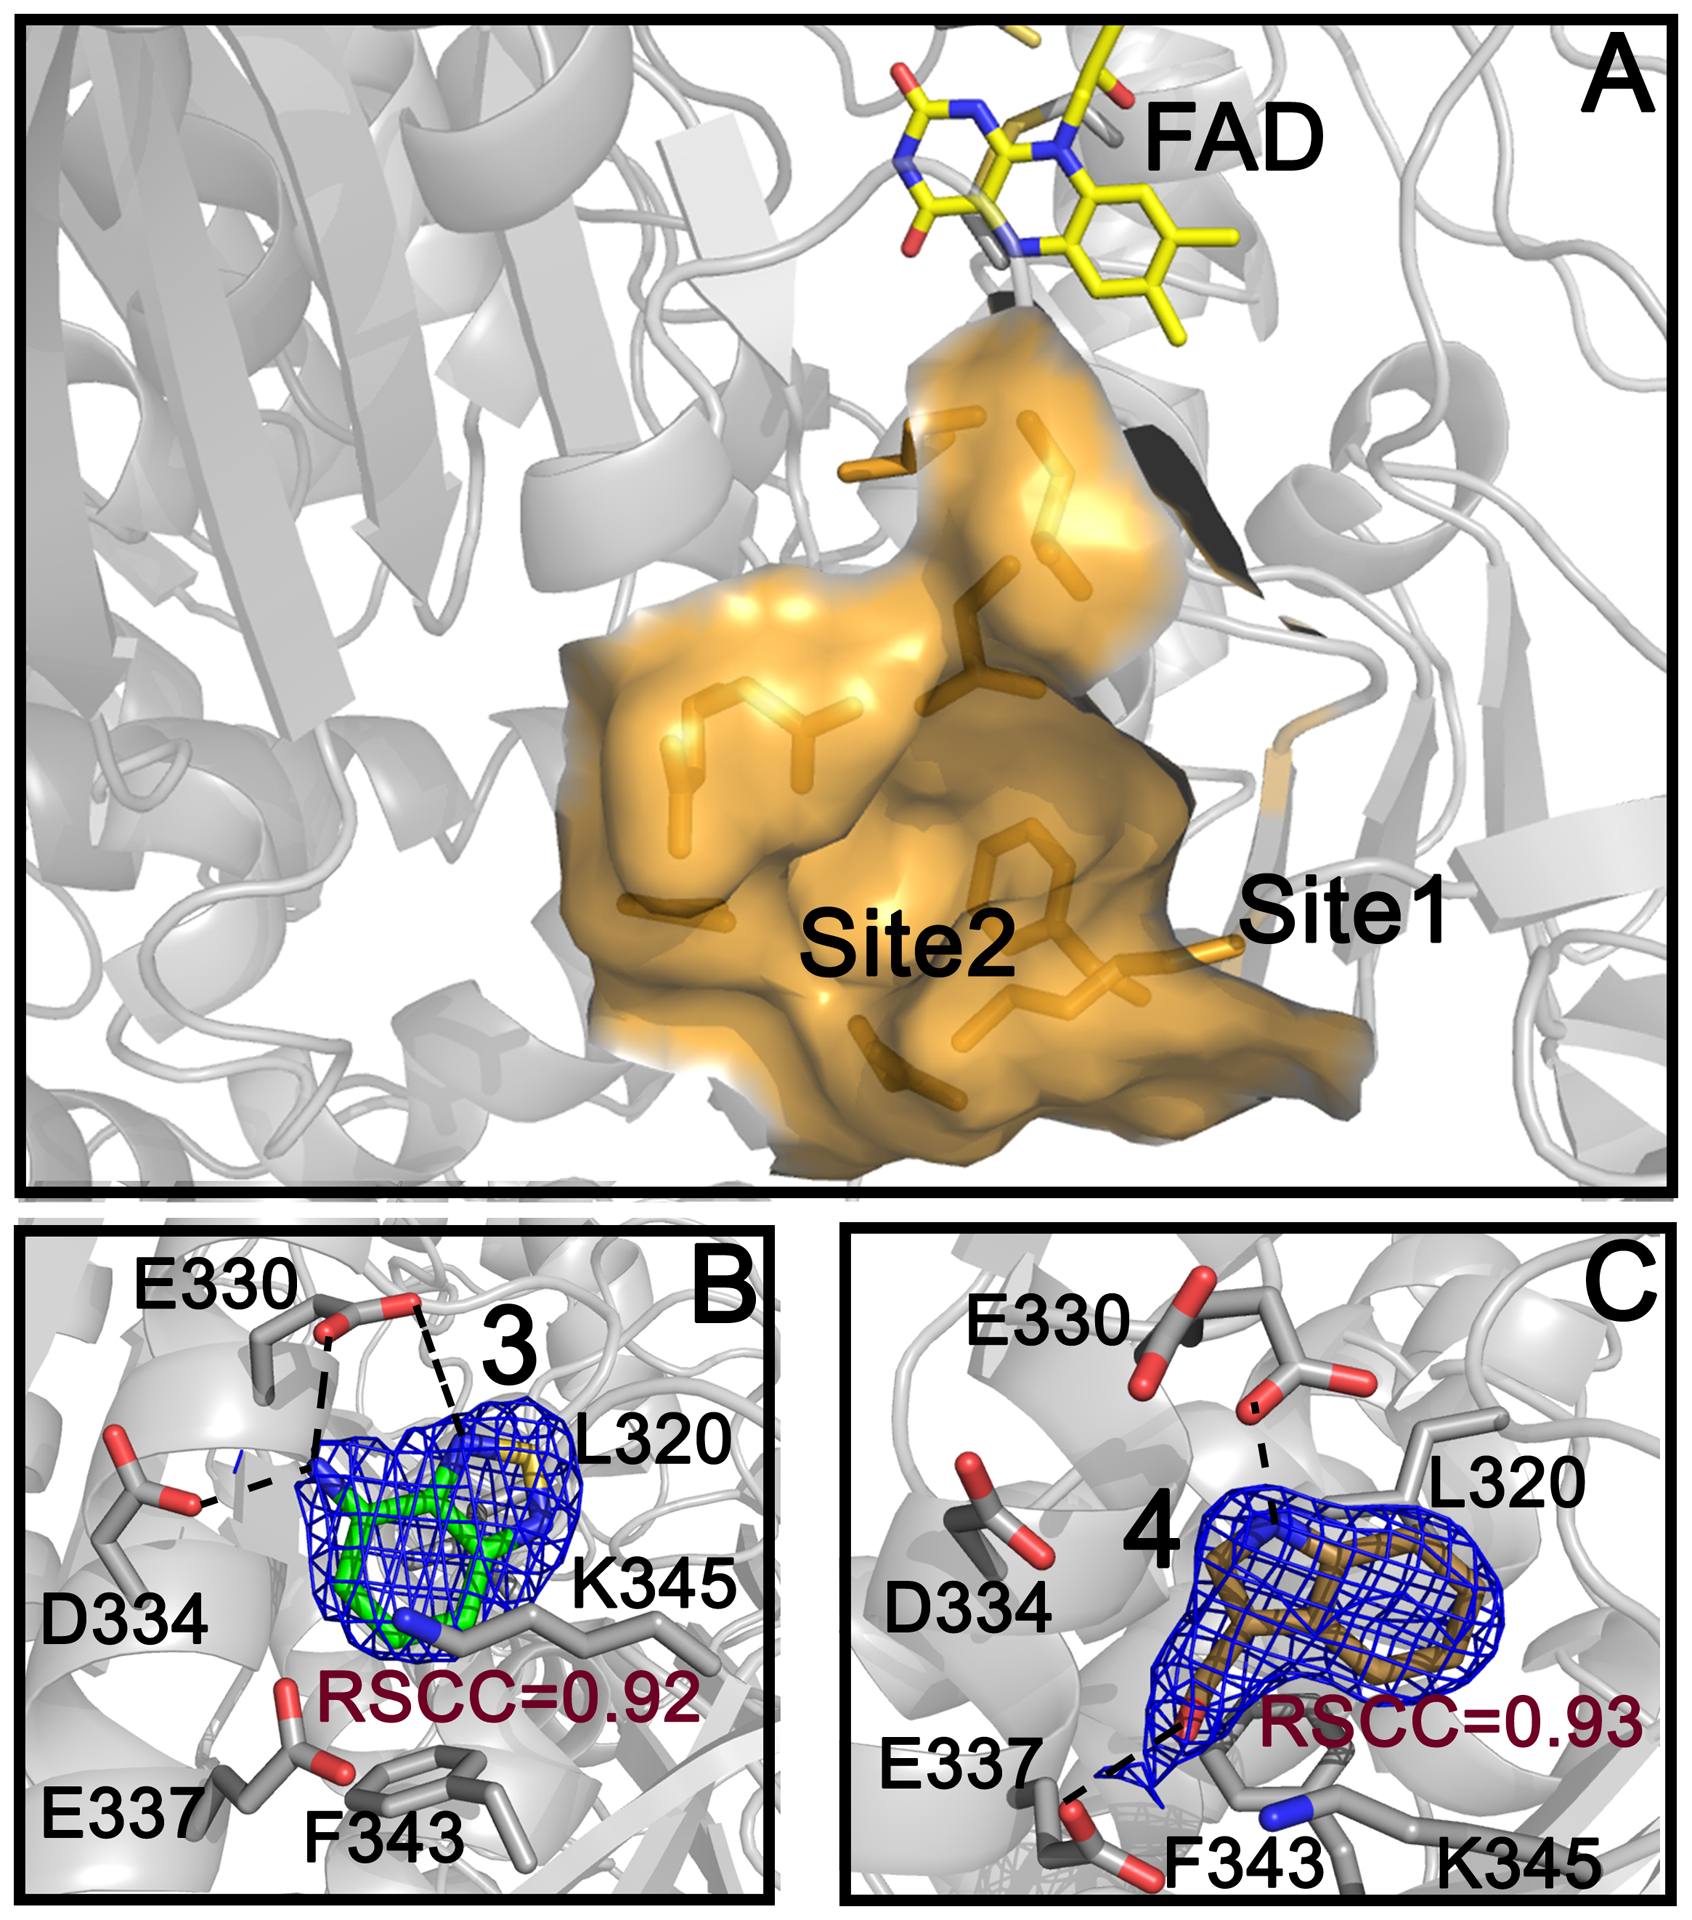
Solvent exposed surface of Site 2 in SmTGR and its proximity to Site 1 are shown (A). The 2Fo-Fc electron density contoured at 1 σ of 3 (in green sticks) and 4 (in gold sticks) are reported in B and C, respectively. FAD is shown as yellow sticks and H-bonds are indicated as dashed lines.