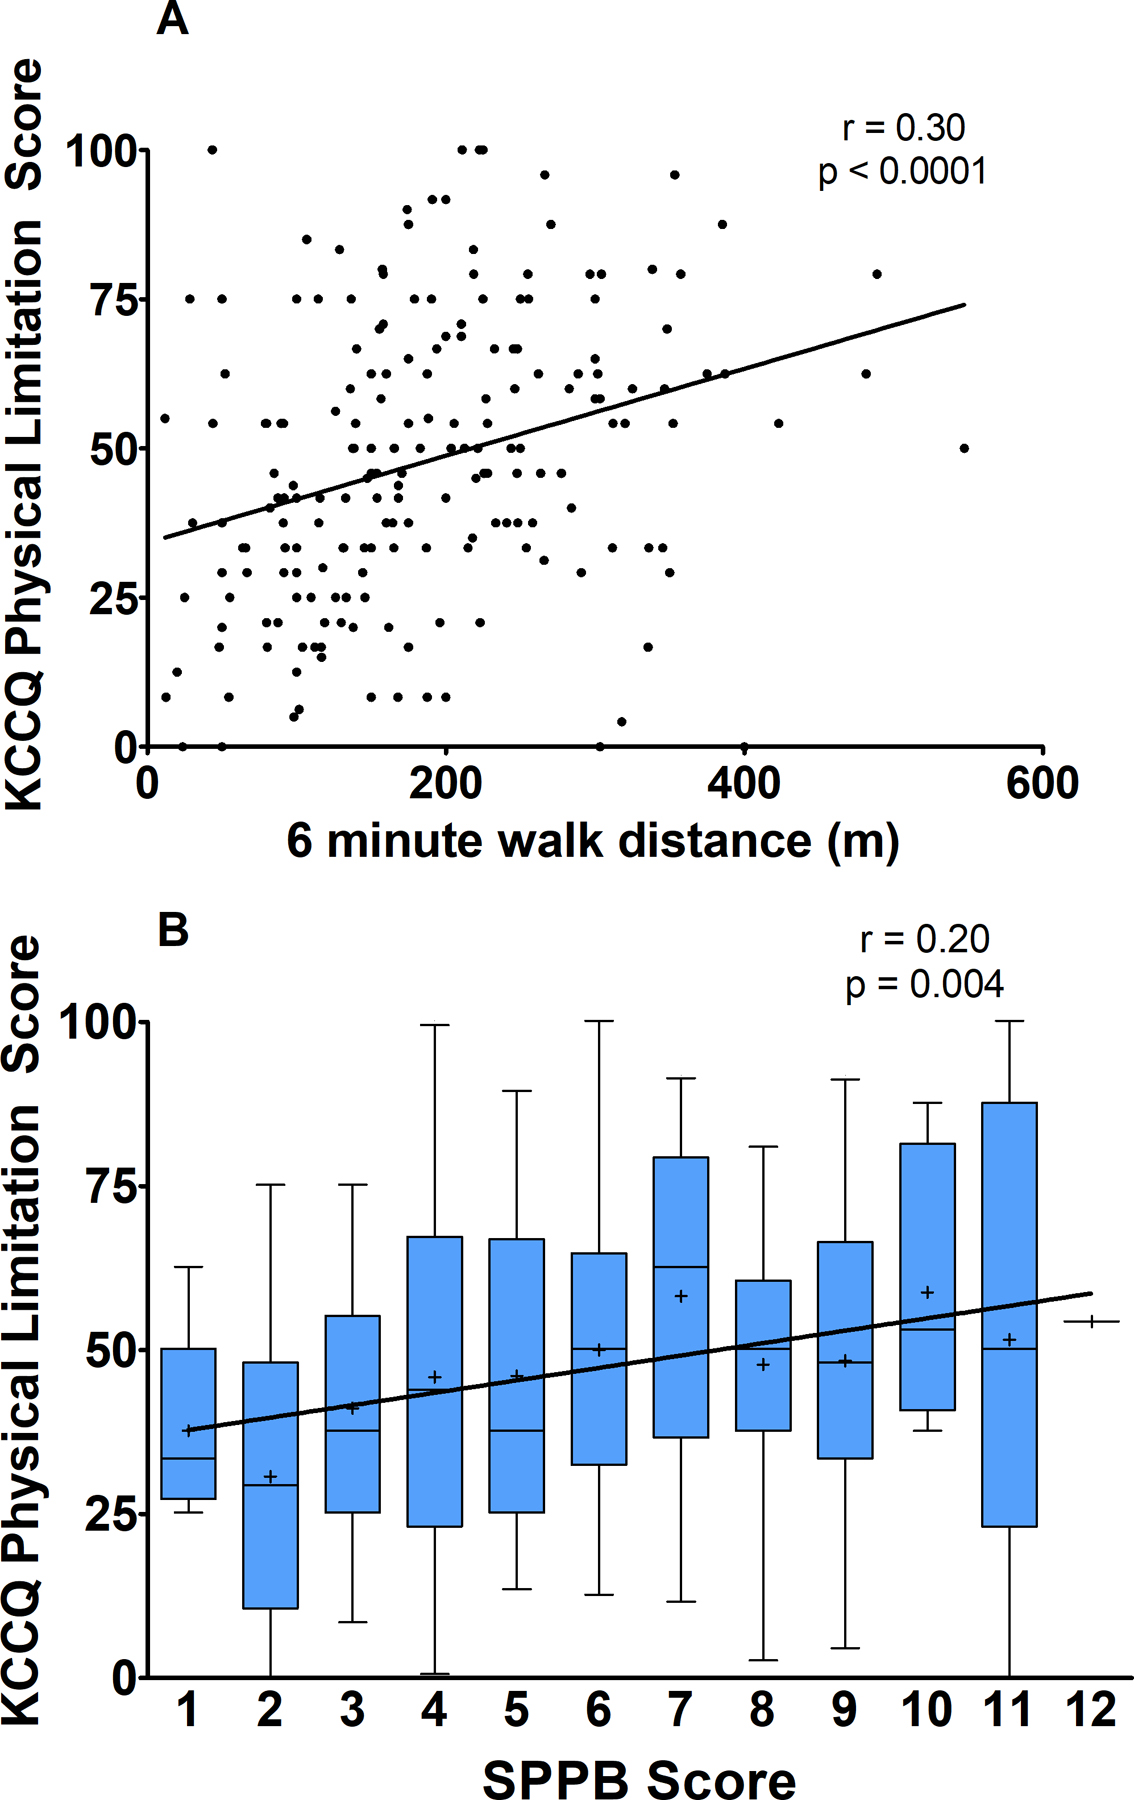
Figure 1.

Relationship of physical function as measured by A) 6-minute walk distance and B) SPPB Total Score with QOL as measured by KCCQ Physical Limitation Score. In panel B, boxes represent 25th, 50th, and 75th percentiles, whiskers represent 95th percentiles, and (+) represents mean.
