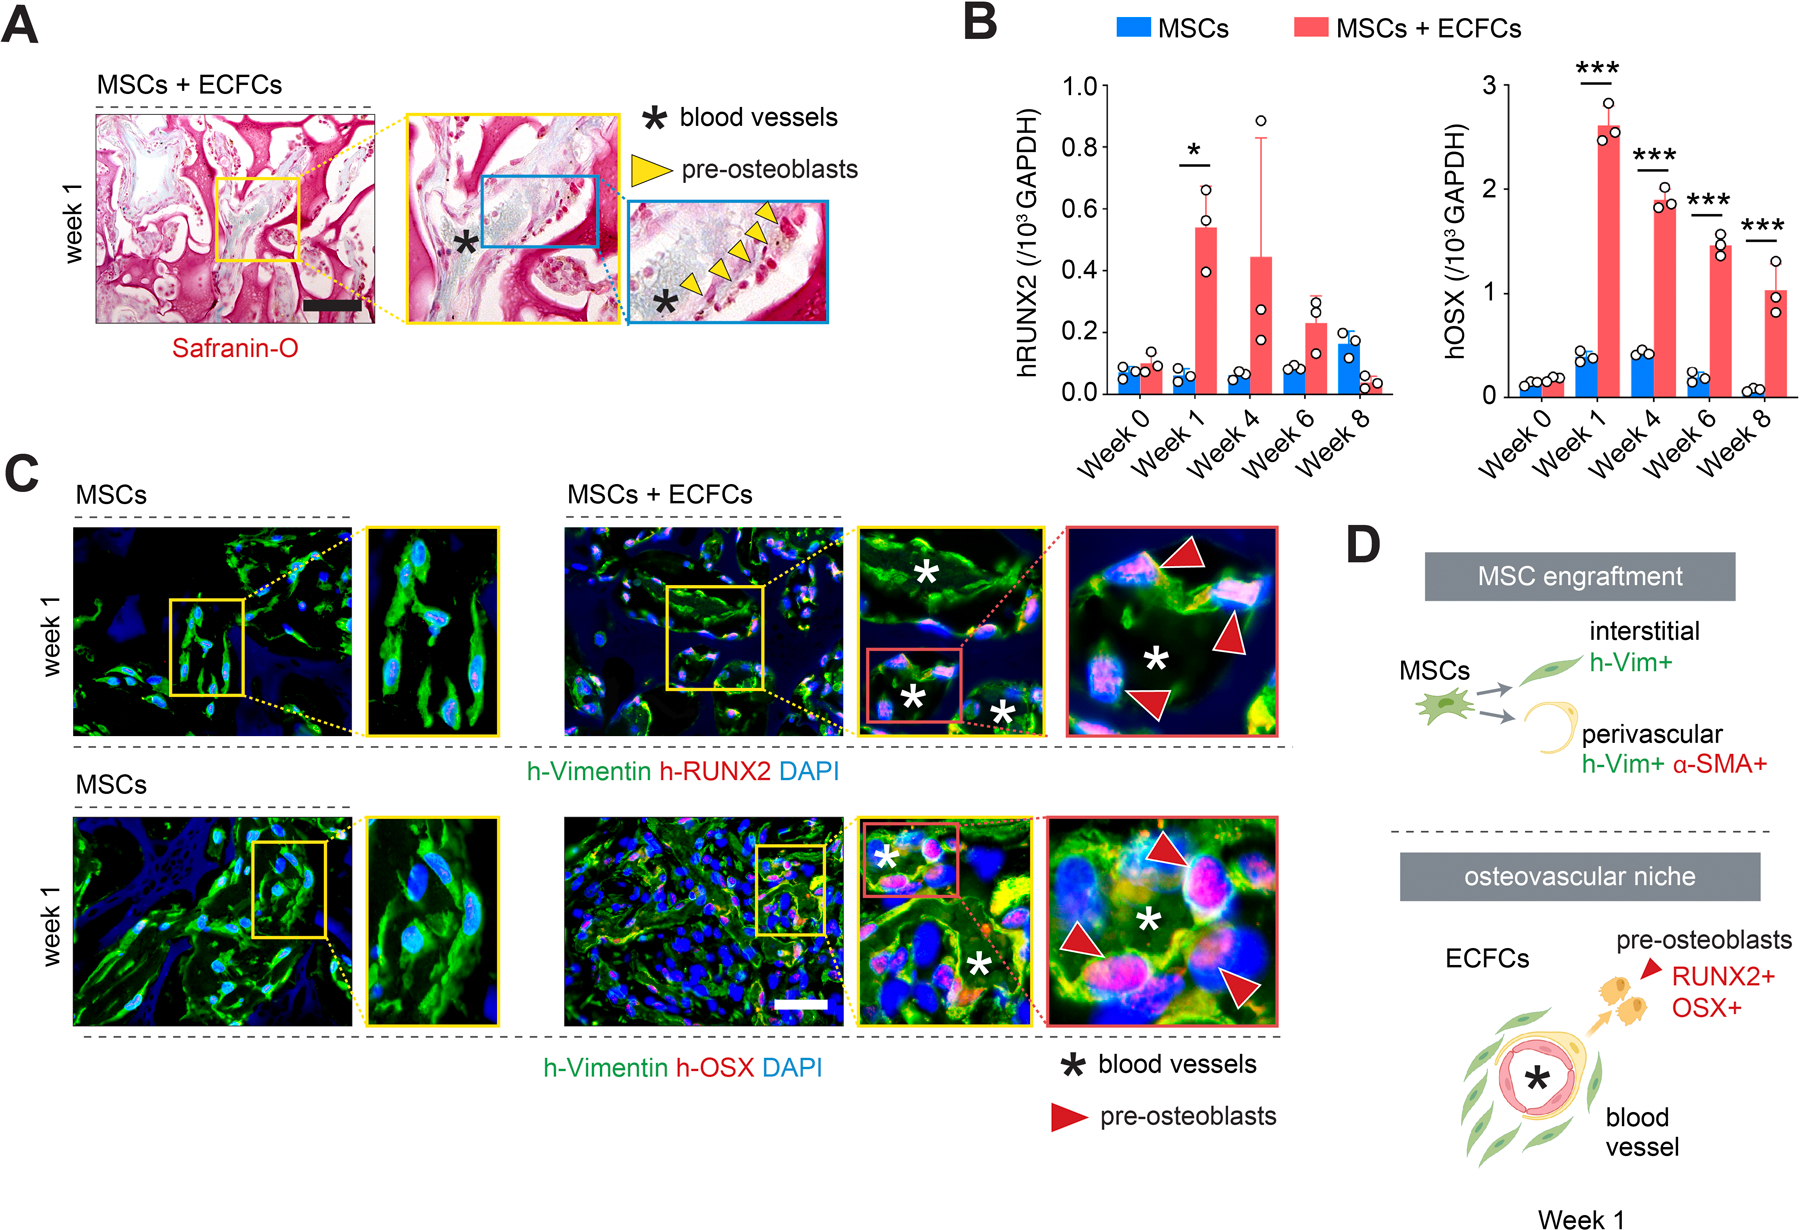
Figure 3.

Differentiation of MSCs into pre-osteoblasts at the osteovascular niches. A) Safranin O staining of grafts seeded with MSCs + ECFCs revealed numerous central blood vessels (asterisks) surrounded by a lining of osteoblast-like cells (yellow arrowheads) in the proximity of the cartilaginous CS-cryogel phase (red color) of the scaffold. B) Quantitative real-time PCR analysis of human RUNX2 and OSX mRNA expression levels in explanted grafts at weeks 1–8. Data normalized to human GAPDH. All primers recognized human-specific transcripts. C) Immunofluorescent staining for pre-osteoblast markers RUNX2 and OSX at week 1. Human pre-osteoblasts (red arrowheads) were identified in grafts seeded with MSCs + ECFCs but not in grafts with only MSCs. D) Schematic illustration depicting the dichotomous engraftment mode of MSCs (top) and the formation of osteovascular niches (bottom) containing ECFC-lined blood vessels, perivascular MSCs, and RUNX2+OSX+ pre-osteoblast. In all quantitative panels, bars represent mean ± s.d. (n ≥ 3). *p < 0.05, *** p < 0.001. Statistical method: ANOVA followed by Bonferroni’s post-test analysis. Scale bars = 100 µm (A,C).
