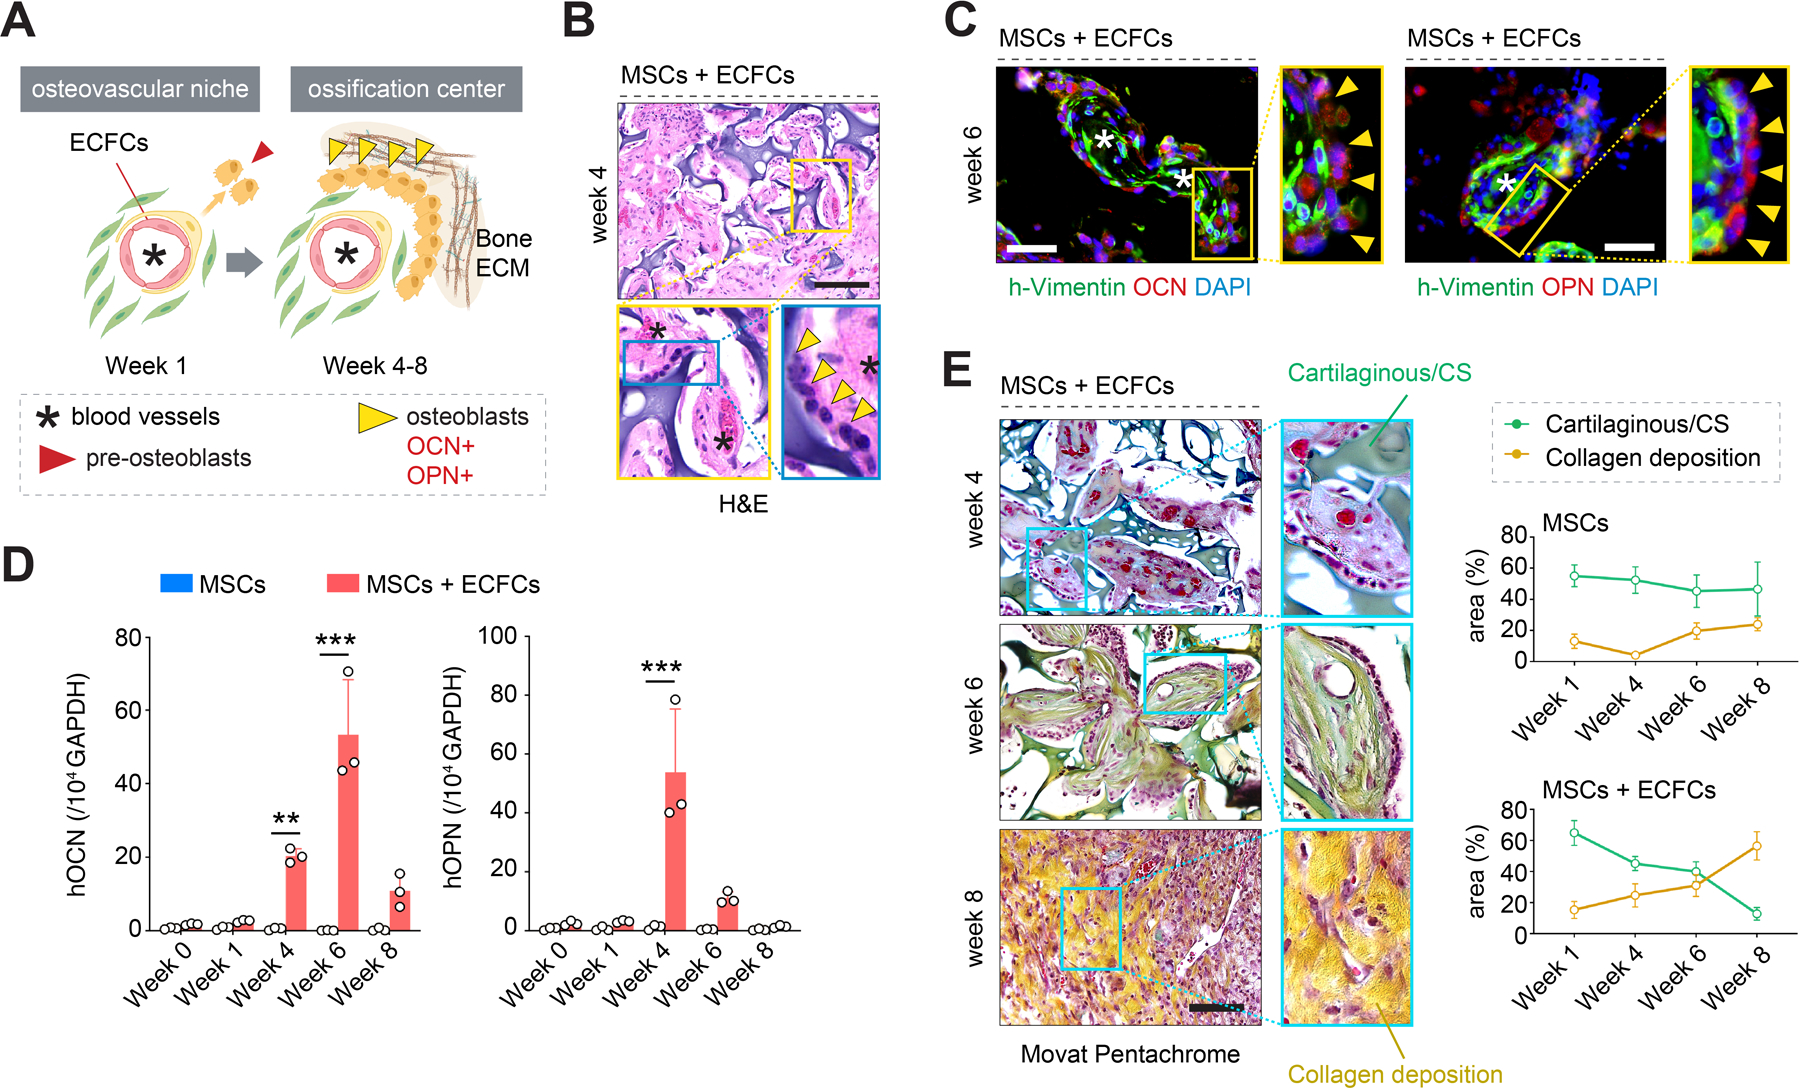
Figure 4.

Generation of functional ossification centers. A) Schematic illustration depicting an initial osteovascular niche and its progression towards a functional ossification center. B) Histological (H&E) staining of grafts seeded with MSCs + ECFCs at week 4 revealed ossification centers containing central vessels (asterisks) and osteoblast lining (yellow arrowheads). C) Immunofluorescent staining of the ossification centers revealed mature human osteoblasts expressing osteocalcin (OCN) and osteopontin (OPN) (yellow arrowheads) as well as blood vessels (asterisks) at week 6. D) Quantitative real-time PCR analysis of human OCN and OPN mRNA expression levels in explanted grafts at weeks 0–8. Data normalized to human GAPDH. All primers recognized human-specific transcripts. E) Movat pentachrome staining of explanted grafts from weeks 4 to 8. Colorimetric analysis revealed a simultaneous increase in collagen deposition (yellow) and the gradual disappearance of the cartilaginous CS-cryogel phase (green) in grafts seeded with MSCs + ECFCs but not in those with only MSCs. In all quantitative panels, bars represent mean ± s.d. (n ≥ 3). **p < 0.01, *** p < 0.001. Statistical method: ANOVA followed by Bonferroni’s post-test analysis. Scale bars = 100 µm (B, C, E).
