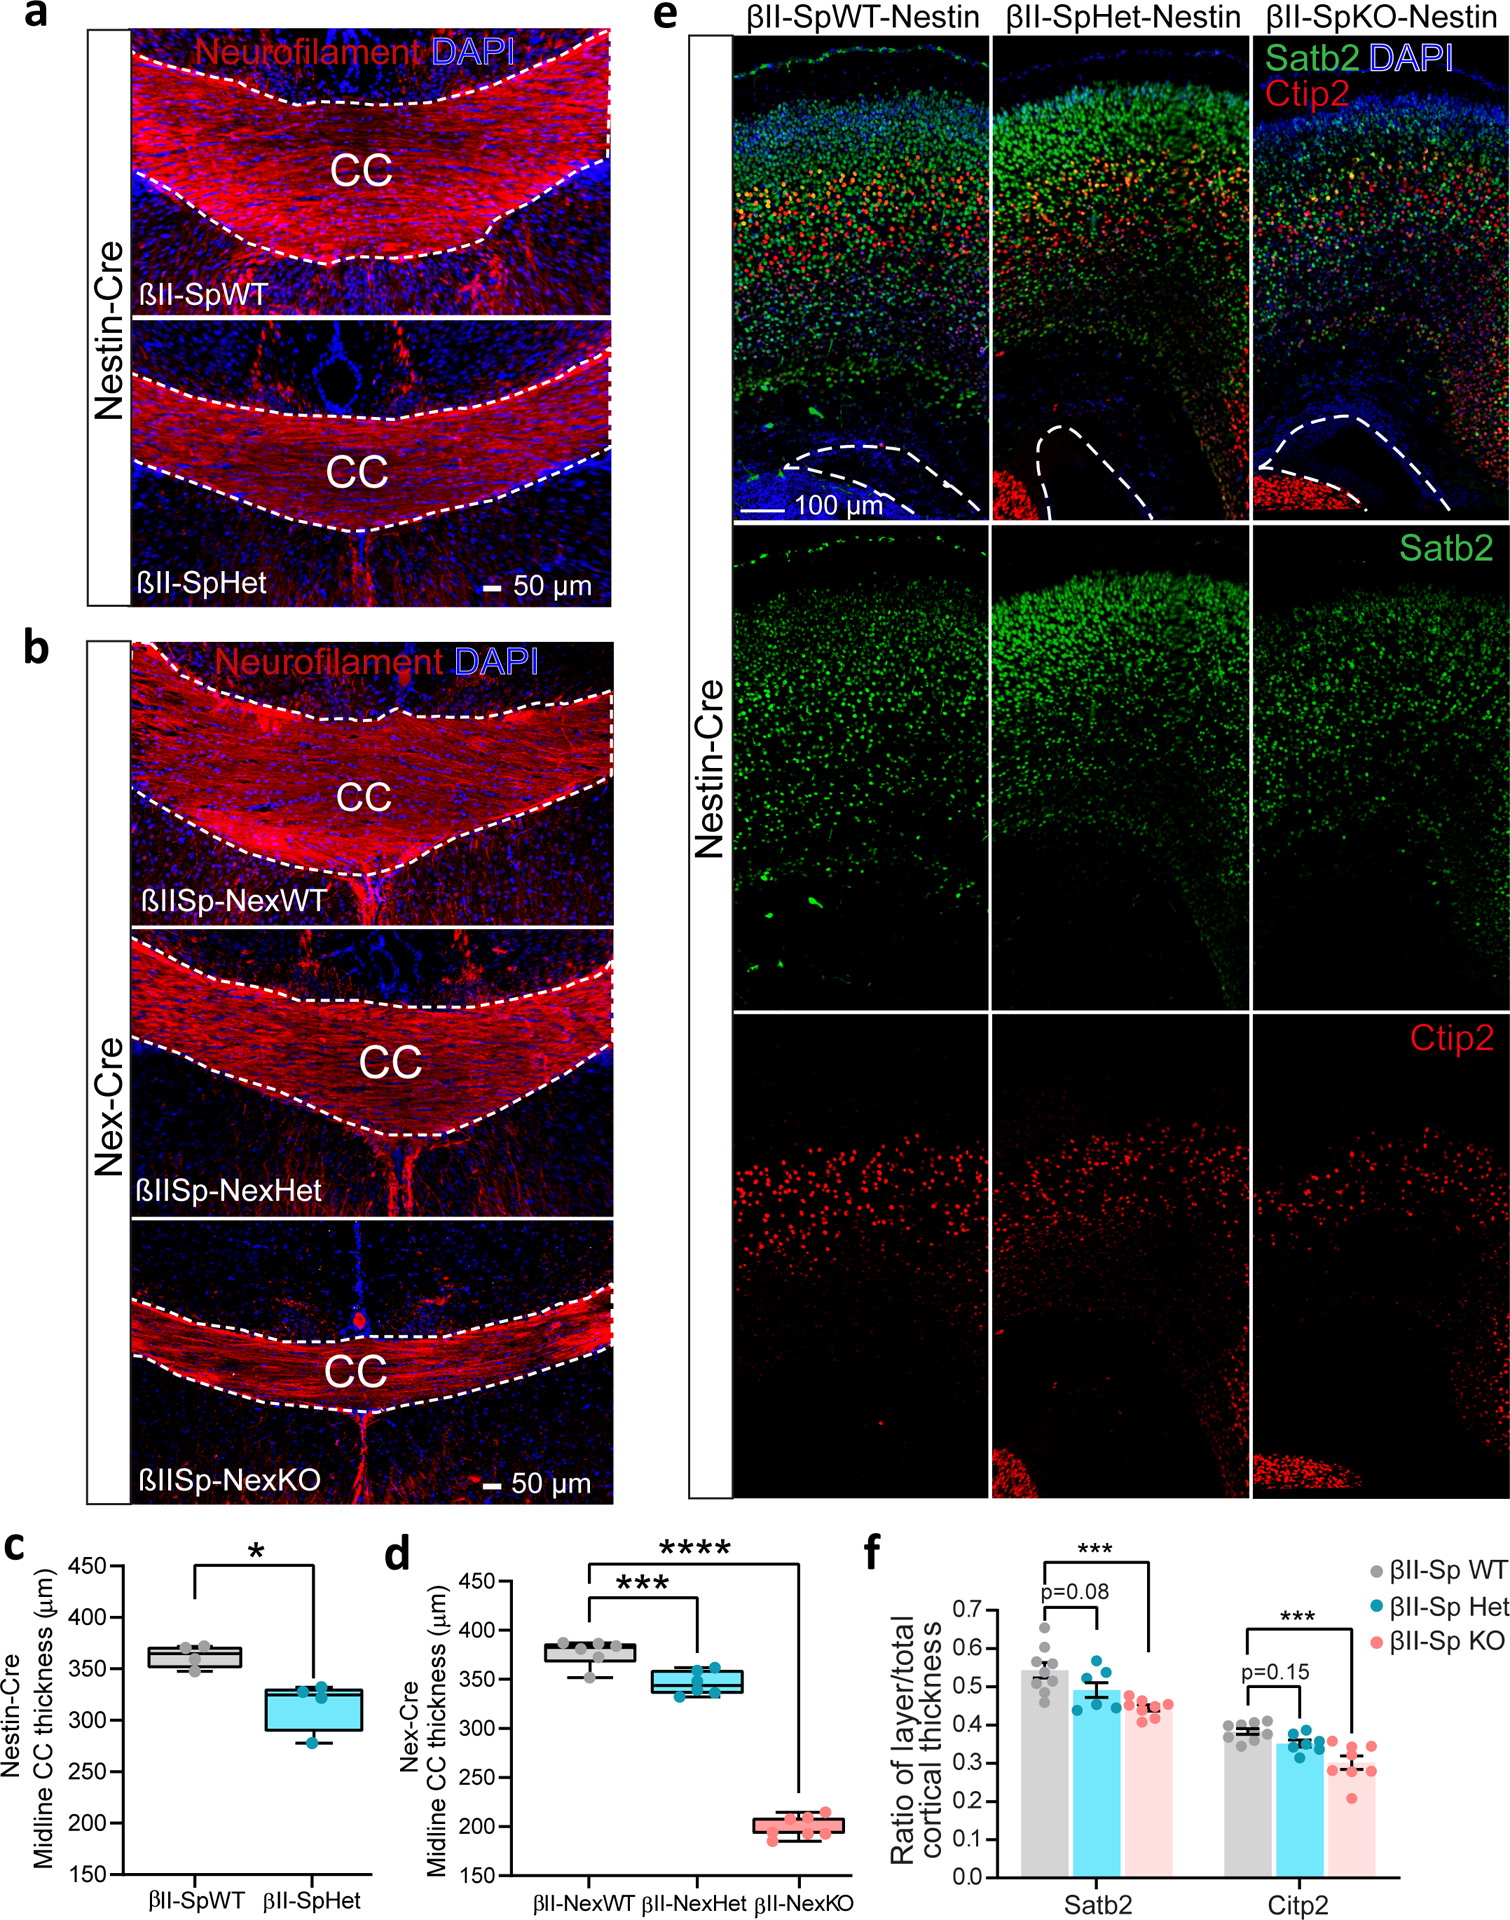
Fig. 6 |. βII-spectrin deficiency disrupts proper cortical development.

a,b, Images of coronal sections from PND25 mice expressing Nestin-Cre (a) or Nex-Cre (b) collected from n = 2 litters and stained for neurofilament and DAPI in one independent experiment. Scale bar, 50 μm. White lines indicate the corpus callosum (CC). c, Midline CC thickness of mice expressing Nestin-Cre (n = 4 mice/genotype). Data represent mean ± SEM. Two-tailed unpaired t-test, *P = 0.0134. d, Midline CC thickness assessed from βII-SpWT (n = 6), βII-SpHet-Nex (n = 6) and βII-SpKO-Nex (n = 7) brains. For c and d, the box plots show all data points from minimum to maximum. Boxes represent data from the lower (25th percentile) to the upper (75th percentile) quartiles. The box center corresponds to the 50th percentile. The median is indicated by a horizontal line inside the box. Whiskers extends from the largest dataset number smaller than 1.5 times the interquartile range (IQR) to the smallest dataset number larger than 1.5IQR. e, Images of PND0 βII-SpWT, βII-SpHet and βII-SpKO brains expressing Nestin-Cre stained for Satb2 and Ctip2 to label neocortical layers and DAPI. A white line indicates the position of the left ventricle. Scale bar, 100 μm. f, Quantification of Sabt2- and Ctip2-positive cortical layer thickness relative to total cortical thickness assessed from βII-SpWT (n = 9), βII-SpHet (n = 8) and βII-SpKO (n = 7) brains expressing Nestin-Cre. Data in d and f represent mean ± SEM and were analyzed by one-way ANOVA with Dunnett’s post hoc test for multiple comparisons. d, ***P = 0.0003, ****P < 0.0001. f, Satb2 (***P = 0.0008), Ctip2 (***P = 0.0002). See statistics summary in Source Data Figure 6.
