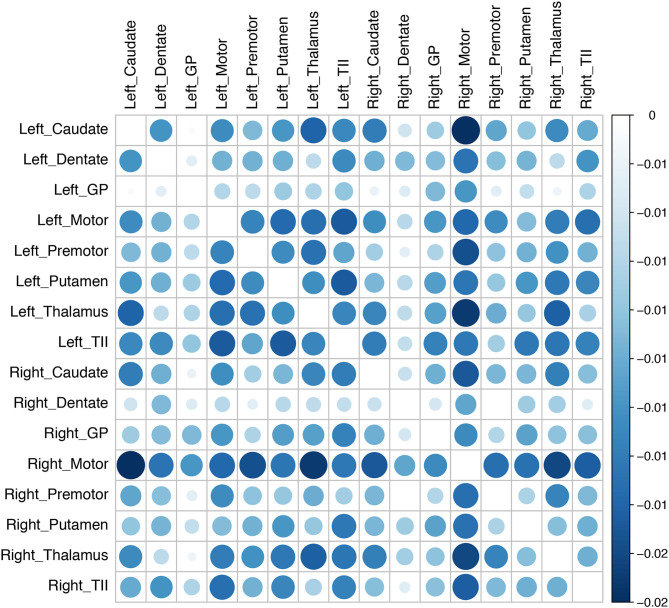
Figure 3.
Changes in connectivity in the tremor network after brain cannula insertion. The changes in connectivity are color coded in the matrix (blue implies decline and red implies increase). The magnitude of connectivity change is indicated by the bubble size, while the color intensity represents the statistical significance. There was an overall decline in the tremor network's connectivity after the canula insertion, although the group-level results did not reach statistical significance (GP, globus pallidus; TII, middle temporal gyrus).

