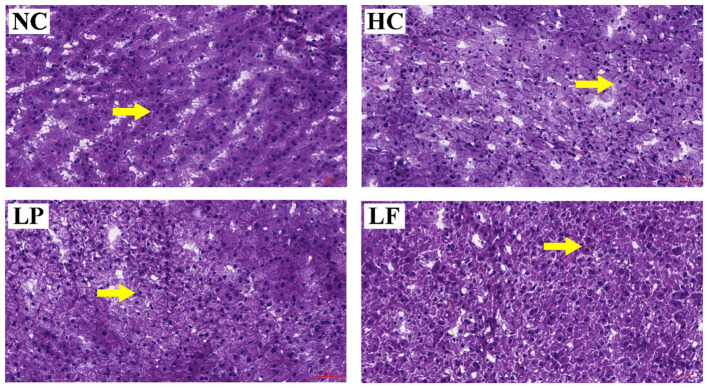
Figure 4.
Histological staining of liver tissues from hyperlipidemic golden hamsters after 8-weeks of treatment. Arrows indicate the situation of cytoplasm near the nucleus. Specimens were visualized and image captured using light microscopy (H & E stain, magnification: ×200, Scale bar, 50 μm). NC, negative control group; HC, positive control group; LP, Lactobacillus plantarum ZY08 supplemented group; LF, Lactobacillus fermentum ZJUIDS06 supplemented group.

