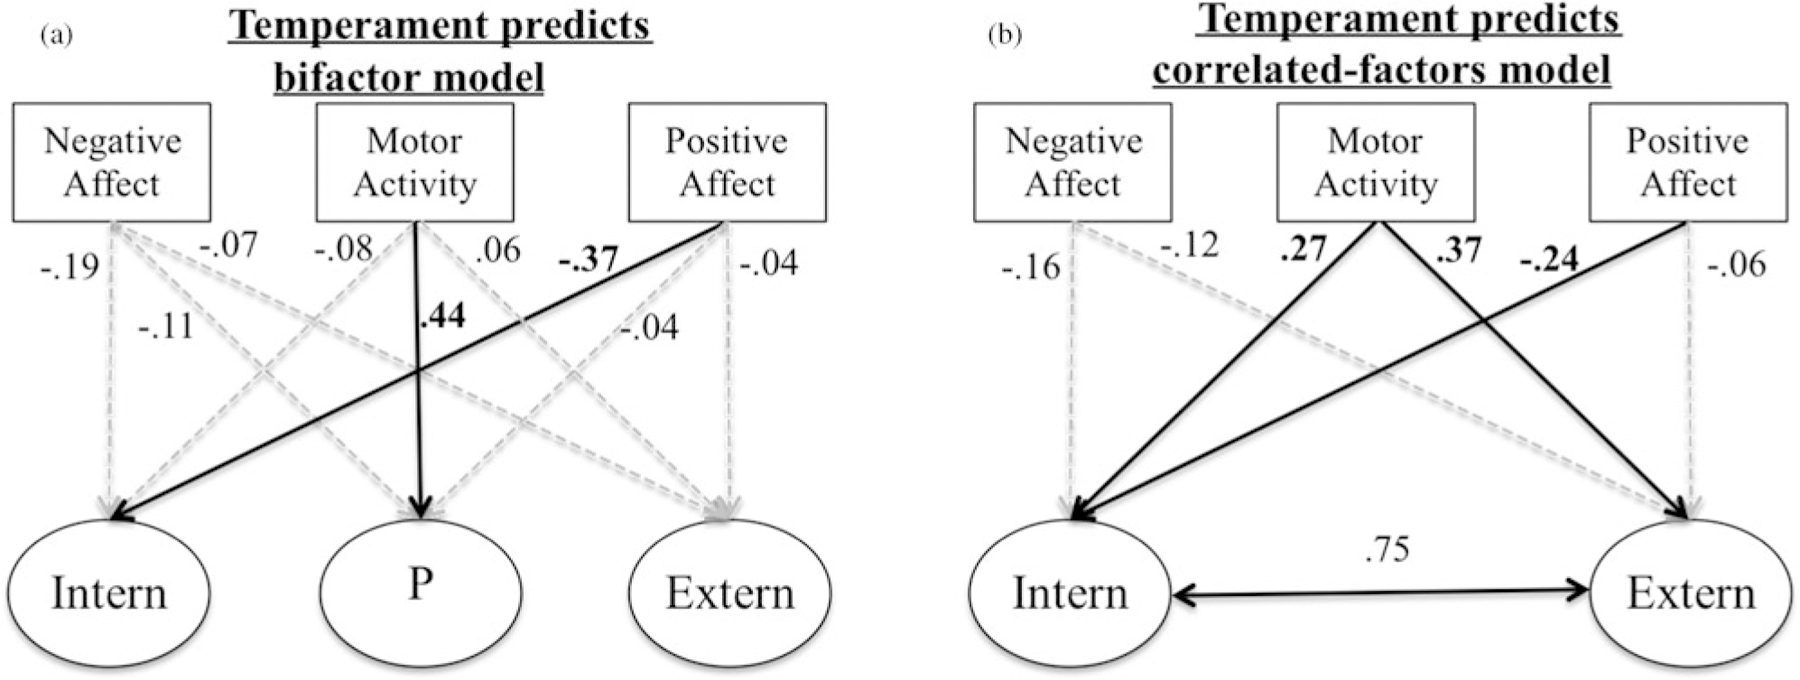
Figure 1.

Standardized regression coefficients for the regression models for temperament dimensions predicting latent psychopathology factor scores in the bifactor model (a) and the correlated factors model (b), along with parent-reported predicting latent psychopathology factor scores in the bifactor model (c) and the correlated factors model (d). Black solid arrows indicate statistically significant relations after correction for multiple comparisons (false discovery rate; FDR). Gray dotted arrows represent nonsignificant regression paths. Albeit the analysis with the bifactor model was performed following the recommended methods from Koch et al. (2018), the data are presented as traditional regression analyses to simplify the presentation. The effects of the covariates are not displayed in the figure, but are shown in Table 1.
