

Abstract
Background:
With stressors of dialysis pre-KT and restoration of kidney function post-KT, it is likely that KT recipients experience a decline in functional status while on the waitlist and improvements post-KT.
Methods:
We leveraged 224,832 KT recipients from the national registry (SRTR, 2/1990–5/2019) with measured Karnofsky Performance Status (KPS, 0–100%) at listing, KT admission, and post-KT. We quantified the change in KPS from listing to KT using generalized linear models. We described post-KT KPS trajectories using adjusted mixed effects models and tested whether those trajectories differed by age, sex, race, and diabetes status using a Wald test among all KT recipients. We then quantified risk adverse post-KT outcomes (mortality and all-cause graft loss (ACGL)) by preoperative KPS and time-varying KPS.
Results:
Mean KPS declined from listing (83.7%) to admission (78.9%) (mean=4.76%, 95%CI:−4.82,−4.70). After adjustment, mean KPS improved post-KT (slope=0.89%/year, 95%CI:0.87,0.91); younger, female, non-Black, and diabetic recipients experienced greater post-KT improvements (pinteractions<0.001). Lower KPS (per 10% decrease) at admission was associated with greater mortality (aHR=1.11, 95%CI:1.10,1.11) and ACGL (aHR=1.08, 95%CI:1.08,1.09) risk. Lower post-KT KPS (per 10% decrease; time-varying) were more strongly associated with mortality (aHR=1.93, 95%CI:1.92,1.94) and ACGL (aHR=1.84, 95%CI:1.83,1.85).
Conclusions:
Functional status declines pre-KT and improves post-KT in the national registry. Despite post-KT improvements, poorer functional status at KT and post-KT are associated with greater mortality and ACGL risk. Due to its dynamic nature, clinicians should repeatedly screen for lower functional status pre-KT to refer vulnerable patients to prehabilitation in hopes of reducing risk of adverse post-KT outcomes.
Introduction
Functional status, or the capacity to perform daily activities to meet basic needs and maintain health and well-being, is recognized as a useful tool for evaluating patients for kidney transplantation (KT).1–3 The prevalence of poor functional status varies depending on how and when it is measured; for example, frailty (14.3%),4 lower extremity functional impairment (46.7%),5 and dependence in activities of daily living (7.6%) and instrumental activities of daily living (31.5%)6 are all highly prevalent in this population. These measures of functional status are particularly appealing for evaluating KT recipients because they are easy to measure and predict adverse post-KT outcomes, including cognitive decline, dementia, early hospital readmission, longer length of stay, delirium, and mortality.5,7–17
However, functional status is dynamic and likely to change before18 and after KT.19 For example, frailty severity, measured by the physical frailty phenotype, increases for 29.0% of KT candidates prior to KT, likely as a result of the stressors of dialysis and worsening comorbidities.18 Frailty was also shown to worsen at first as a result of the stressor of surgery, but improve by 3 months post-KT likely as a result of the restoration of kidney function.19 Such studies have been limited to small, prospective cohorts from select transplant centers that focused mainly on frailty as a measure of functional status.
Unlike frailty, which incorporates both patient-reported and objective measures for 5 domains of function (gait speed, grip strength, exhaustion, unintentional weight loss, and low activity), the Karnofsky Performance Scale (KPS)20–23 is a physician-reported measure of functional status that is routinely collected in the Scientific Registry of Transplant Recipients (SRTR). KPS has been shown to be predictive of poor outcomes in cancer24 and geriatric patients,25 and, like frailty, is likely to be associated with adverse outcomes post-KT. However, little is known about its trajectories before and after KT, and whether KPS at admission for KT predicts critical transplant outcomes like mortality and graft loss among KT recipients.
We sought to better understand changes in functional status for KT recipients by leveraging a cohort 224 832 adult KT recipients from the national registry to: 1) describe changes in KPS from listing to KT, 2) describe trajectories in KPS post-KT, 3) identify subgroups of vulnerable patients, as by age, sex, race, and diabetes status, 4) test whether lower KPS is associated with greater mortality and all-cause graft loss, and 5) test whether improvements in KPS post-KT would reduce risk of mortality and all-cause graft loss (ACGL) on the national level.
MATERIALS AND METHODS
National Registry Data
We leveraged national registry data from the Scientific Registry of Transplant Recipients (SRTR) to better understand KPS trajectories pre- and post-KT (KPS, see below for assessment details). The SRTR data system includes data on all donors, wait-listed candidates, and transplant recipients in the United States, submitted by the members of the Organ Procurement and Transplantation Network (OPTN). The Health Resources and Services Administration, US Department of Health and Human Services provides oversight to the activities of the Organ Procurement and Transplantation Network, and SRTR contractors.
We ascertained KPS, as described below, for 234 093 first-time, adult KT recipients between February 1990 and June 2019; we excluded recipients without a measure of KPS at time of listing (n=9,261, 4.0%). Recipient, transplant, and donor factors for the remaining 224 832 (96.0%) KT recipients who were included in the study were additionally ascertained from the national registry, such as age, sex, race/ethnicity, diabetes, cause of end-stage kidney disease (ESKD), donor type, and years on dialysis.
This study was reviewed by the institutional review board at Johns Hopkins School of Medicine and was determined to qualify for an exemption under 45 CFR 46.101(b), as study participants cannot be identified directly or through linked identifiers.
Functional Status
KPS is a physician-reported measure of functional status that has been widely used for risk stratification of cancer patients since 1948,25 and became a requirement by the OPTN for risk adjustment of transplant outcomes in the U.S. national registry.20 KPS ranges from 0% to 100% in increments of 10%, where lower scores represent poorer functional status (Table 1), and was implemented at time of listing, KT admission, 6 months post-KT, and annually thereafter. KPS was analyzed continuously and categorically based on physician responses (≤70%, 80%, 90%, 100%). Lower functional status was defined as a KPS of ≤70% to identify recipients in the lowest quartile of functional status.
Table 1.
Karnofsky Performance Status.48
| Score: Description |
|---|
| 100%: Normal no complaints; no evidence of disease. |
| 90%: Able to carry on normal activity; minor signs or symptoms of disease. |
| 80%: Normal activity with effort; some signs or symptoms of disease. |
| 70%: Cares for self; unable to carry on normal activity or to do active work. |
| 60%: Requires occasional assistance, but is able to care for most of his personal needs. |
| 50%: Requires considerable assistance and frequent medical care. |
| 40%: Disabled; requires special care and assistance. |
| 30%: Severely disabled; hospital admission is indicated although death not imminent |
| 20%: Very sick; hospital admission necessary; active supportive treatment necessary. |
| 10%: Moribund; fatal processes progressing rapidly. |
| 0%: Dead. |
Functional Status at KT
Differences in participant characteristics by KPS groups were tested using analysis of variance (ANOVA) for continuous variables. A chi-squared test was used to compare proportions across KPS groups for categorical variables.
Differences in Functional Status from Listing to KT
We calculated the difference in KPS from time of listing to time of KT for each recipient. Given that the differences were normally distributed, we used a generalized linear equation with a Gaussian distribution to assess the unadjusted mean difference in functional status. We then assessed whether mean differences pre-KT were associated with time on the waitlist, age, sex, race, years on dialysis, cause of ESKD, donor type, and diabetes status.
Trajectories in Functional Status Post-KT
Despite KPS being an ordinal measure, we assume that functional status has an underlying latent continuum like many other clinical constructs, such as pain, cognitive function, and health-related quality of life.7,26–29 Leveraging KPS as the best measure available in the registry to assess functional status, we describe trajectories of the continuous latent construct (or latent growth curves) by examining repeated measures of post-KT KPS using multilevel mixed-effects models, as has been done in prior studies.30 We incorporated a random slope (time) and random intercepts (transplant center and person) to account for between-center and between-person variations. With observed missingness in KPS which rises with year since KT (Table S1), this maximum likelihood based method provides a valid approach for estimating trajectories and associations when assuming that the dependent variable, in this case KPS, is missing at random (MAR).31,32 Models were adjusted for age, sex, race, years on dialysis, cause of ESKD, donor type, and diabetes status. We used maximum likelihood estimation and selected an unstructured correlation structure for the random effects to generate the best possible model fit, allowing the model to directly calculate each variance and covariance values reflected by the data. Additionally, we assessed whether post-KT KPS trajectories differed by older age (≥65 vs. <65 years), female sex, race (Black vs. non-Black), diabetes status, donor type, delayed graft function, post-KT graft function (eGFR, calculated using post-KT serum creatinine and the CKD-EPI formula), and acute rejection by testing for interaction with each of the factors in separate models using a Wald test.
Functional Status, Risk of Mortality, and All-Cause Graft Loss
We tested whether KPS at KT admission was associated with increased risk of all-cause mortality, death with a functioning graft, and ACGL using Cox proportional hazards models to generate hazard ratios, adjusting for age, sex, race, years on dialysis, cause of ESKD, donor type, and diabetes status (Figure S1). ACGL was used to include kidney allografts loss among deceased recipients. We then tested whether those associations differed by age, sex, race, and diabetes status by testing for interaction with each of the factors in separate models using a Wald test. The same analyses were conducted for time-varying KPS (accounting for specific KPS score values at each time point post-KT) to determine whether improvements in KPS post-KT contribute to improvements in risk of all-cause mortality, death with a functioning graft, and ACGL. We assessed the predictive validity of KPS on all-cause mortality and ACGL by comparing Harrell’s c-statistics from a baseline model without KPS (including age, sex, race, years on dialysis, cause of ESKD, donor type, and diabetes status) to a model with KPS at admission in addition to the other variables in the baseline model.
Sensitivity Analyses
Since KPS is not normally distributed, we conducted sensitivity analyses to address the observed ceiling effects in KPS assessment using a random-effects Tobit model for all abovementioned trajectory analyses, a method conceived to estimate linear relationships when there is left- or right-censoring in the measured outcome.33 We additionally addressed the potential impact of competing risks prior to end of follow-up, such as death or graft loss, by conducting inverse probability weighting in conjunction with GEE (WGEE) assuming an “immortal” cohort.34 Lastly, we conducted analyses using multilevel ordinal logistic regression to assess whether results remain robust if KPS is treated as an ordinal outcome.
Statistical Analyses
All analyses were performed using Stata version 15 (StataCorp, College Station, TX). Two-sided p-values < 0.05 were considered statistically significant.
Results
Study Population
Among the 224 832 KT recipients in the national registry, the mean age was 51 (SD=13.6), 61.0% were men, 26.0% were Black, 33.2% had diabetes. Prior to KT, the median years on dialysis was 2.1 years (inter-quartile range [IQR]=0.4, 4.6) (Table 2).
Table 2. Demographic characteristics of kidney transplant (KT) recipients between February 1990 and June 2019 (n=224,832) by functional status.
Karnofsky Performance Status (KPS) was used to measure functional status and ranges from 0%−100%. A cutoff of KPS ≤ 70% was selected to represent the lowest quartile of functional status.
| Factor | Functional Status | |||
|---|---|---|---|---|
| Total (n=224,832) |
>70% (n=147,805) |
≤70% (n=77,027) |
p-value | |
| Age, mean (SD) | 51.4 (13.6) | 50.7 (13.8) | 52.6 (13.1) | <0.001 |
| Female, % | 39.0 | 38.7 | 39.6 | <0.001 |
| Race, % | <0.001 | |||
| White | 50.7 | 52.7 | 47.0 | |
| Black | 26.0 | 24.4 | 29.2 | |
| Asian | 5.9 | 6.0 | 5.7 | |
| Hispanic | 15.6 | 15.2 | 16.4 | |
| Other | 1.7 | 1.7 | 1.8 | |
| Diabetes, % | 33.2 | 29.7 | 39.6 | <0.001 |
| Deceased Donor, % | 66.4 | 61.8 | 75.2 | <0.001 |
| Cause of ESKD, % | <0.001 | |||
| Glomerular diseases | 23.8 | 25.8 | 19.8 | |
| Diabetes | 25.3 | 22.7 | 30.3 | |
| Hypertension | 20.5 | 19.8 | 21.9 | |
| Other | 30.5 | 31.8 | 28.0 | |
| Years on dialysis, median (IQR) | 2.1 (0.4, 4.6) | 1.8 (0.1, 4.2) | 2.8 (0.8, 5.3) | <0.001 |
Functional Status at Time of Listing and Pre-KT Functional Status Trajectories
Among KT recipients, 23.5% had a KPS ≤70% at time of listing. By the time of KT admission, 39.9% experienced declines in KPS, 16.4% experience improvements in KPS, and 43.7% remained stable. The unadjusted mean KPS declined from listing (83.7%) to admission (78.9%) (mean=−4.76%, 95%CI: −4.82, −4.70) (Figure 1). After adjustment, longer time on the waitlist (difference=−0.09% per 1 month increase on the waitlist, 95%CI: −0.10, −0.09; p<0.001), older age (difference=−0.27%, 95%CI: −0.43, −0.11; p<0.001), being female (difference=−0.15, 95%CI: −0.28, −0.03; p=0.02), and having a greater number of years on dialysis (difference=−0.15% per 1 year increase on dialysis, 95%CI: −0.18, −0.13; p<0.001) were associated with declines in KPS.
Figure 1. Mean functional status (KPS) pre- and post-KT among recipients between February 1990 and June 2019 (n=224,832).
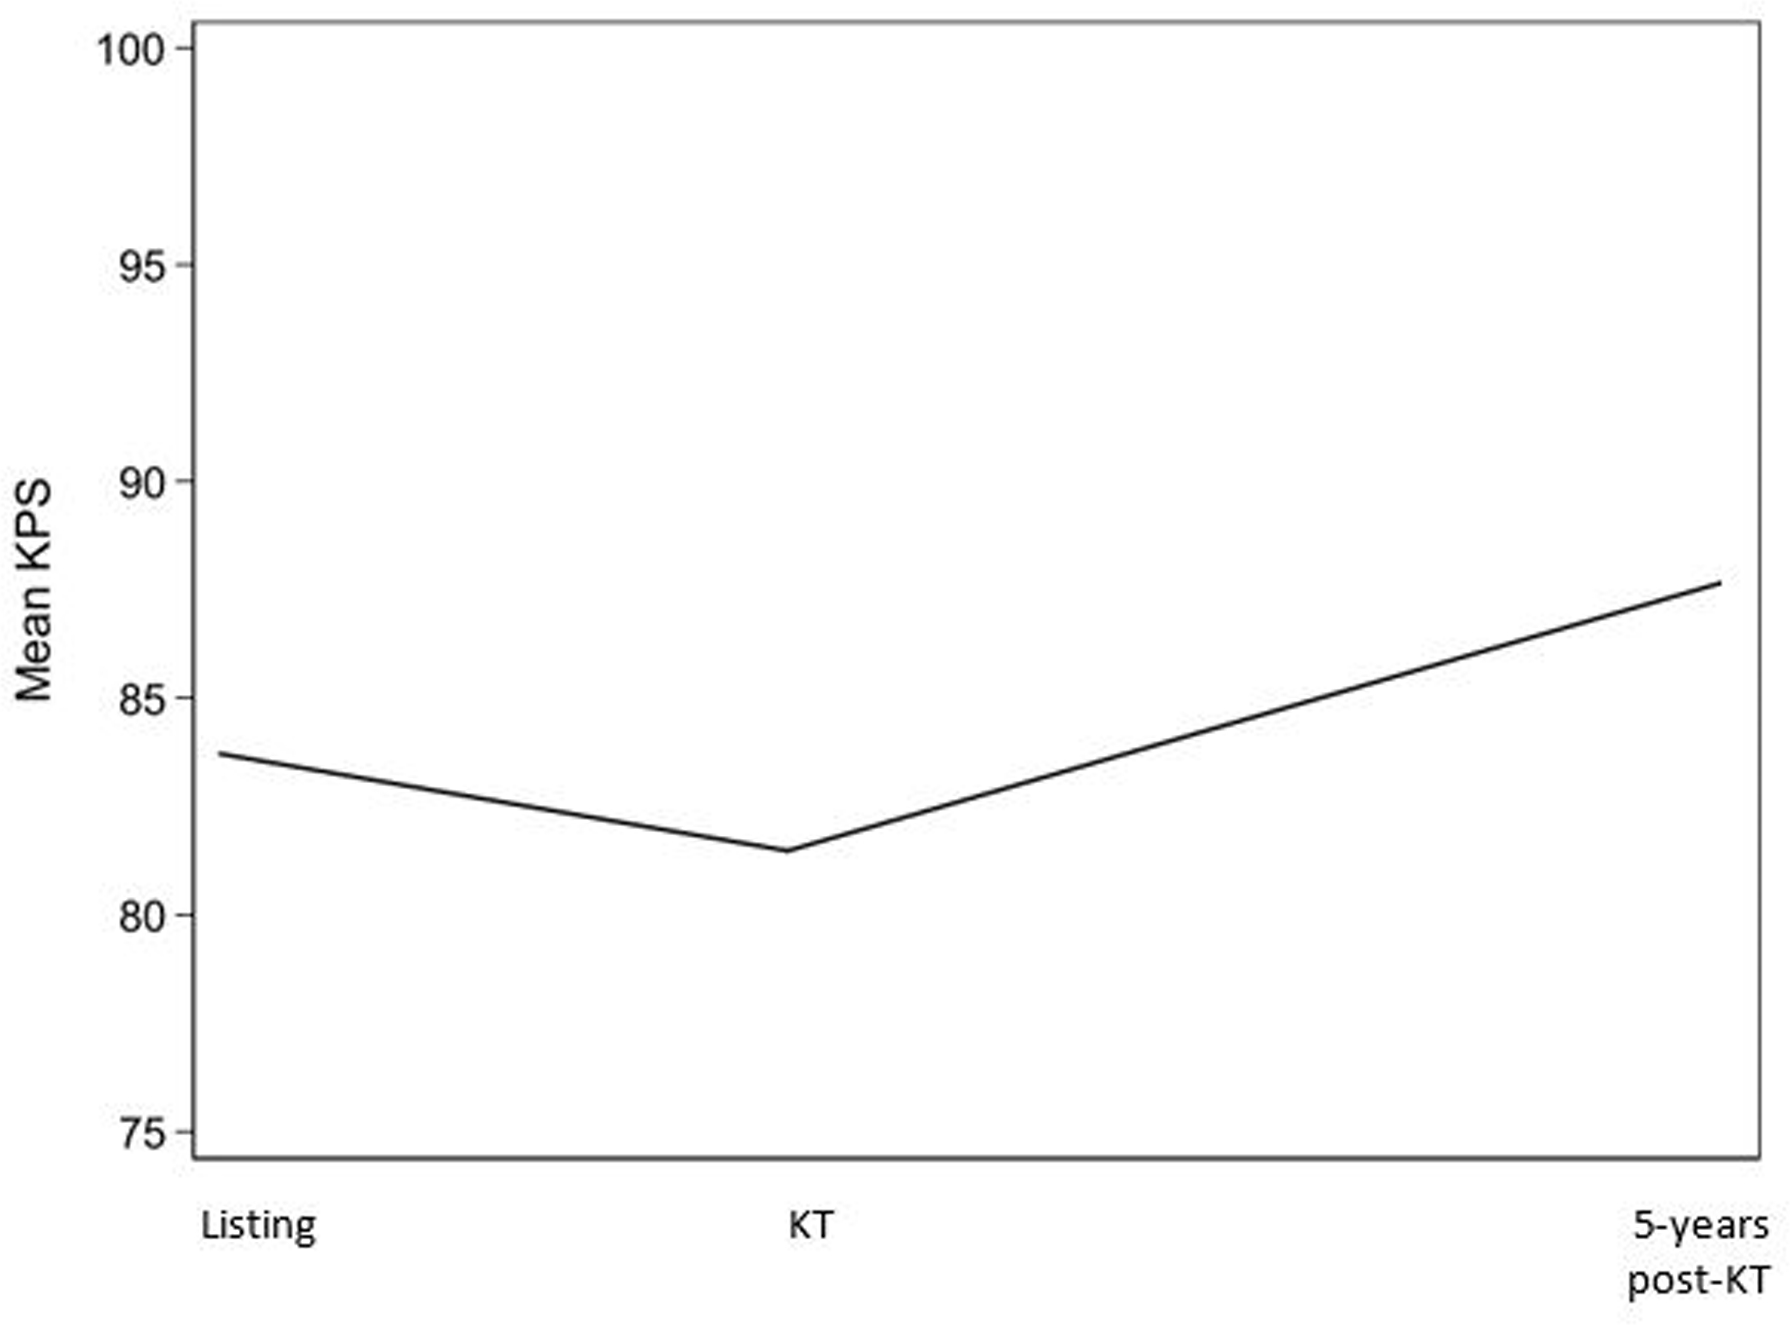
The Karnofsky Performance Status (KPS) ranges from 0% to 100%, where higher values represent better functional status. Unadjusted means of KPS at time of listing, KT, and 5-year post-KT are presented. Time between listing and KT varies between participants.
Functional Status at KT Admission
Among KT recipients, 34.3% of recipients had KPS ≤70% at admission for KT (Table 2). Recipient factors associated with lower KPS at time of KT admission include older age (p<0.001), female sex (p<0.001), Black race (p<0.001), diabetes status (p<0.001), cause of ESKD (p<0.001), and years on dialysis prior to KT (Table 2).
Functional Status Trajectories Post-KT in the National Registry
The mean unadjusted KPS for KT admission, 6 months, 1 year, 3 years, and 5 years post-KT was 78.9%, 87.9%, 88.6%, 88.4%, and 88.0%, respectively. After adjustment, the mean KPS at admission was 88.4%, and this score improved linearly at a rate of 0.89%/year (95%CI: 0.87, 0.91). Trajectories in KPS differed by age (≥65: 0.47%/year vs. <65: 0.96%/year, pinteraction<0.001), sex (females: 0.94%/year vs. males: 0.86%/year, pinteraction<0.001), race (Black: 0.79%/year vs. non-Black: 0.92%/year, pinteraction<0.001), diabetes status (diabetes: 2.75%/year vs. no diabetes: 0.74%/year, pinteraction<0.001), donor type (living: 0.71%/year vs. deceased: 0.99%/year), delayed graft function (yes: 1.10%/year vs. no: 0.84%/year), and acute rejection (yes: 0.72%/year vs. 0.89%/year) (Table 3). Additionally, better post-KT graft function was associated with better functional status in the first follow-up visit post-KT (difference in KPS per 10 unit increase in eGFR= 0.2%, 95%CI: 0.2, 0.3) and greater improvements in functional status post-KT (difference in KPS slope per 10 unit increase in eGFR: 0.04%/year, 95%CI: 0.04, 0.05).
Table 3. Estimates of functional status (Karnofsky Performance Status, KPS) levels at admission and postkidney transplantation (KT) trajectories among KT recipients in the Scientific Registry of Transplant Recipients between February 1990 and June 2019 (n= 224,832) by age, sex, race, and diabetes.
The Karnofsky Performance Status (KPS) score ranges from 0% to 100%. All models were adjusted for age, sex, race, cause of ESKD, years on dialysis, donor type, and diabetes status. Interaction models represent separate models for each respective factor. Bolded estimates represent statistically significant associations.
| Models | Level | Slope | ||
|---|---|---|---|---|
| KPS Score (%) at KT (95%CI) | p-value | KPS Score (%)/Year (95%CI) | p-value | |
| Overall | 88.4 (87.7, 89.0) | <0.001 | 0.89 (0.87, 0.91) | <0.001 |
| Interaction Models | Difference (95%CI) | p-value | Difference (95%CI) | pinteraction |
| Age (≥65 vs. <65) | −1.4 (−1.5, −1.3) | <0.001 | −0.49 (−0.53, −0.44) | <0.001 |
| Sex (female vs. male) | −0.4 (−0.5, −0.4) | <0.001 | 0.08 (0.04, 0.11) | <0.001 |
| Race (Black vs. non-Black) | 0.1 (0.01, 0.2) | 0.03 | −0.13 (−0.17, −0.09) | <0.001 |
| Diabetes (diabetes vs. no diabetes) | −5.1 (−5.2, −5.0) | <0.001 | 2.01 (1.95, 2.06) | <0.001 |
| Donor type (living vs. deceased) | 2.84 (2.74, 2.95) | <0.001 | −0.28 (−0.32, −0.24) | <0.001 |
| Delayed graft function (yes vs. no) | −2.16 (−2.28, −2.04) | <0.001 | 0.26 (0.21, 0.31) | <0.001 |
| Acute rejection (yes vs. no) | −1.16 (−1.48, −0.84) | <0.001 | −0.18 (−0.30, −0.05) | 0.005 |
Functional Status at KT Admission and Risk of Adverse Outcomes
Cumulative incidence of mortality comparing recipients with a KPS ≤70% vs. KPS>70% was 11.2% vs. 5.5% at 6 months, 18.4% vs. 10.3% at 1 year, 39.0% vs. 26.8% at 3 years, and 57.5% vs. 46.0% at 5 years (Figure 2). Lower KPS at KT admission was associated with a greater risk of post-KT mortality (aHR=1.11 per 10% decrease in KPS, 95%CI: 1.10, 1.11), and KPS improved predictive performance compared to a model that does not account for KPS (KPS model: c-statistic=0.60; crude model: c-statistic=0.58). This association differed by age; specifically, among older recipients (aHR=1.12 vs. 1.10, pinteraction=0.045) the association between KPS and risk of mortality was stronger compared to younger recipients. The association did not differ by sex (pinteraction=0.59), race (pinteraction=0.05), or diabetes status (pinteraction=0.05) (Table 4). Similar results were observed for risk of death with a functioning graft (Table 4)
Figure 2. Cumulative incidence of mortality among KT recipients between February 1990 and June 2019 (n=224,832) by functional status (KPS) at time of KT admission.

The Karnofsky Performance Status (KPS) ranges from 0% to 100%, where higher values represent better functional status.
Table 4. Associations with post-KT mortality and all cause graft loss among adult KT recipients (February 1990-June 2019) by functional status (KPS) at time of admission and change in functional status post-KT (n=224,832).
The Karnofsky Performance Status (KPS) ranges from 0% to 100%. Change in KPS refers to time-varying post-KT KPS. Results reflect the hazard ratios for every 10% reduction in KPS. All models were adjusted for age, sex, race, cause of ESKD, years on dialysis, and diabetes status. Older age interactions compared recipients ≥65 vs. <65 years. Subgroup hazard ratios are presented for models with interactions, which were performed separately for each respective factor. Bolded estimates represent statistically significant associations.
| KPS at Admission | Change in KPS | |||||
|---|---|---|---|---|---|---|
| Models | HR (95% CI) | P>z | HR (95% CI) | P>z | ||
| Mortality | ||||||
| Overall | 1.11 (1.10, 1.11) | <0.001 | 1.93 (1.92, 1.94) | <0.001 | ||
| Interaction Models | Yes | No | pinteraction | Yes | No | pinteraction |
| Older Age | 1.12 (1.10, 1.13) | 1.10 (1.09, 1.11) | 0.045 | 1.84 (1.83, 1.86) | 2.01 (2.00, 2.03) | <0.001 |
| Female Sex | 1.10 (1.09, 1.11) | 1.11 (1.10, 1.11) | 0.59 | 1.98 (1.96, 2.00) | 1.91 (1.89, 1.92) | <0.001 |
| Black Race | 1.12 (1.10, 1.13) | 1.10 (1.09, 1.11) | 0.05 | 1.93 (1.90, 1.95) | 1.94 (1.92, 1.95) | 0.51 |
| Diabetes | 1.10 (1.09, 1.11) | 1.11 (1.10, 1.12) | 0.05 | 1.95 (1.91, 1.99) | 1.93 (1.92, 1.94) | 0.42 |
| Death with Functioning Graft | ||||||
| Overall | 1.08 (1.07, 1.09) | <0.001 | 2.18 (2.15, 2.22) | <0.001 | ||
| Interaction Models | Yes | No | pinteraction | Yes | No | pinteraction |
| Older Age | 1.11 (1.09, 1.14) | 1.07 (1.06, 1.09) | 0.009 | 2.09 (2.04, 2.15) | 2.23 (2.19, 2.28) | <0.001 |
| Female Sex | 1.08 (1.06, 1.10) | 1.08 (1.07, 1.10) | 0.66 | 2.23 (2.17, 2.28) | 2.16 (2.12, 2.20) | 0.05 |
| Black Race | 1.07 (1.05, 1.09) | 1.08 (1.07, 1.10) | 0.30 | 2.14 (2.08, 2.21) | 2.20 (2.16, 2.24) | 0.16 |
| Diabetes | 1.08 (1.06, 1.09) | 1.08 (1.06, 1.10) | 0.63 | 2.13 (2.03, 2.24) | 2.19 (2.15, 2.23) | 0.31 |
| All-cause graft loss | ||||||
| Overall | 1.08 (1.08, 1.09) | <0.001 | 1.84 (1.83, 1.85) | <0.001 | ||
| Interaction Models | Yes | No | pinteraction | |||
| Older Age | 1.11 (1.09, 1.12) | 1.08 (1.07, 1.08) | <0.001 | 1.81 (1.79, 1.83) | 1.86 (1.84, 1.87) | <0.001 |
| Female Sex | 1.07 (1.07, 1.08) | 1.09 (1.08, 1.09) | 0.04 | 1.86 (1.84, 1.88) | 1.83 (1.82, 1.85) | 0.01 |
| Black Race | 1.08 (1.07, 1.09) | 1.08 (1.08, 1.09) | 0.84 | 1.78 (1.76, 1.80) | 1.87 (1.85, 1.88) | <0.001 |
| Diabetes | 1.09 (1.08, 1.09) | 1.08 (1.07, 1.09) | 0.35 | 1.89 (1.85, 1.93) | 1.84 (1.83, 1.85) | 0.03 |
Abbreviations: HR=hazard ratio; CI=confidence interval.
Cumulative incidence of ACGF comparing recipients with a KPS ≤70% vs. KPS>70% was 13.4% vs. 8.4% at 6 months, 20.9% vs. 13.9% at 1 year, 44.4% vs. 34.0% at 3 years, and 63.8% vs. 54.6% at 5 years (Figure 3). Lower KPS at KT admission was also associated with increased risk of post-KT ACGL (aHR=1.08 per 10% decrease in KPS, 95%CI: 1.08, 1.09) and KPS improved predictive performance compared to a model that does not account for KPS (KPS model: c-statistic=0.57; crude model: c-statistic=0.55). This association also differed by subgroups; specifically, among older (aHR=1.11 vs. 1.08, pinteraction<0.001) and male recipients (aHR=1.09 vs. 1.07, pinteraction=0.04), the association between KPS and risk of ACGL was stronger compared to their counterparts. The association did not differ by race (pinteraction=0.84) or diabetes status (pinteraction=0.35) (Table 4).
Figure 3. Cumulative incidence of all-cause graft loss among KT recipients between February 1990 and June 2019 (n=224,832) by functional status (KPS) at time of KT admission.

The Karnofsky Performance Status (KPS) ranges from 0% to 100%, where higher values represent better functional status.
Post-KT Changes in Functional Status and Risk of Subsequent Adverse Outcomes
Associations with adverse post-KT outcomes became stronger with post-KT changes in KPS; specifically, lower post-KT KPS was associated with a greater risk of mortality (aHR=1.93 per 10% decrease in KPS, 95%CI:1.92–1.94) and risk of death with a functioning graft. This association differed by subgroups; associations between lower post-KT KPS and mortality were stronger for female recipients (aHR=1.98 vs. 1.91, pinteraction<0.001) and younger recipients (aHR=2.01 vs. 1.84, pinteraction<0.001). Associations did not differ by race (pinteraction=0.51) or diabetes status (pinteraction=0.42) (Table 4). Similar results were observed for risk of death with a functioning graft (Table 4).
Lower post-KT KPS was also more strongly associated with a greater risk of post-KT ACGL (aHR=1.84 per 10% decrease in KPS, 95%CI:1.83–1.85). This association differed by all subgroups; specifically, associations between lower post-KT KPS and ACGF were stronger for younger recipients (aHR=1.86 vs. 1.81, pinteraction<0.001), non-Black recipients (aHR=1.87 vs. 1.78, pinteraction<0.001), female recipients (aHR=1.86 vs. 1.83, pinteraction=0.01), and recipients with diabetes (aHR=1.89 vs. 1.84, pinteraction=0.03) (Table 4).
Sensitivity Analyses
After accounting for KPS ceiling effects, direction and magnitude of associations remained relatively robust across analyses among KT recipients in the national registry. The only exception was regarding differences in KPS levels at KT admission by race. Specifically, after accounting for ceiling effects, Black recipients had lower KPS at KT admission compared to their counterparts (difference=−0.7%/year, 95%CI: −0.8, −0.6) (Table S2).
After accounting for mortality as a potential competing risk, direction and magnitude of association remained relatively robust for the overall KPS trajectory (0.43%/year, 95%CI: 0.13, 0.73) and KPS trajectories by diabetes status (difference=2.01%/year, 95%CI: 1.95, 2.06). Additionally, the direction of the association between KPS trajectory and age remained robust despite losing significance (difference=−0.18, 95%CI: −1.36, 0.99). Less is clear for associations by sex and race (Table S3).
After treating KPS as an ordinal outcome, inferences did not change, such that functional status improved post-KT. Specifically, for each year post-KT, the odds of having a higher KPS score (better functioning) is 1.13 times greater after adjustment (OR=1.129, 95%CI: 1.125, 1.131).
Discussion
Among 224 832 KT recipients, 39.9% experienced declines in KPS, 16.4% experience improvements in KPS, and 43.7% remained stable prior to KT. The mean KPS declined from time of listing for KT to KT admission (mean=−4.8%, 95%CI: −4.8, −4.7). Despite lower mean scores by the time of KT admission, scores improved at a rate of nearly 1% per year (0.89%/year, 95%CI: 0.87, 0.91) on average post-KT. However, improvements were disproportionate across groups; younger recipients (≥65: 0.47%/year vs. <65: 0.96%/year, pinteraction<0.001), females (females: 0.94%/year vs. males: 0.86%/year, pinteraction<0.001), non-Black race (Black: 0.79%/year vs. non-Black: 0.92%/year, pinteraction <0.001), recipients with diabetes (diabetes: 2.75%/year vs. no diabetes: 0.74%/year, pinteraction<0.001), recipients with deceased donors (living: 0.71%/year vs. deceased: 0.99%/year), recipients with delayed graft function (yes: 1.10%/year vs. no: 0.84%/year), and recipients without acute rejection (yes: 0.72%/year vs. no: 0.89%/year) experienced greater improvements in KPS than their counterparts. Furthermore, lower KPS at admission was associated with a greater risk of post-KT mortality (aHR=1.11, 95%CI: 1.10, 1.11) and ACGL (aHR=1.08, 95%CI: 1.08, 1.09), but those associations were stronger for post-KT changes in KPS (mortality: aHR=1.93, 95%CI:1.92–1.94; ACGL: aHR=1.84, 95%CI:1.83–1.85). Similar results were observed for risk of death with a functioning graft.
These findings are consistent with prior studies that have demonstrated the dynamic nature of functional status in ESKD18 and other solid organ transplants.35 One such study by our group demonstrated that approximately 29.0% experience greater severity of frailty among KT candidates on the waitlist, while 34.6% demonstrated improvements in frailty.18 This study extends those findings a diverse national cohort, leveraging the KPS as a surrogate for frailty among all KT recipients in the United States. Notably, in this study, a greater proportion of KT recipients (39.9%) experienced declines in functional status prior to KT, which supports a robust body of prior evidence demonstrating the negative impact of poor kidney function on functional status, physical frailty, and physical function.18,36–39
Despite poorer functional status at admission (KPS=88.3%), trajectories improved by almost 1% per year with the restoration of kidney function. This finding supports prior research highlighting the overall benefits expected from KT, with patients demonstrating improvements in cognitive function,7 physiologic reserve,19 and health-related quality of life,40 despite having lower function at time of KT.
However, this study highlights disparities in those improvements by age, sex, race, and diabetes. Specifically, among older, male, and Black recipients, functional status did not improve as steeply as their counterparts. These disparities may be a result of implicit bias, recognizing that KPS is physician-reported and not standardized when implemented across diverse settings in the U.S.41 This is important to consider in parallel with other measures, like the frailty phenotype. For example, prior studies have demonstrated that frailty as measured by the physical frailty phenotype can identify vulnerable patients with ESKD and demonstrate changes in functional status over time regardless of age, sex, and race.7,10,18 It is possible that KPS as a measure of functional status does not adequately identify those most vulnerable in certain subgroups, whereas measures like frailty are more accurate for identifying vulnerability across highly heterogeneous, diverse populations. This may be due to the fact that KPS is physician-reported, whereas frailty incorporates both objective and patient-reported components. Notably, in terms of predictive validity on mortality, KPS at admission for KT (c-statistic for mortality=0.60) proved much weaker than was previously reported for both frailty as measured by the physical frailty phenotype (c-statistic for mortality=0.75)10 and impairment in lower extremity function as measured by the Short Physical Performance Battery (c-statistic for mortality=0.76).5 As such, how well KPS measures functional status comparatively to other novel measures should be revisited for purposes of risk stratification among patients with ESKD.
Interestingly, those with diabetes had worse functional status at KT (difference=−5.1, 95%CI:−5.2, −5.0), but experienced greater improvements in KPS compared to their nondiabetic counterparts (difference=2.01%/year). These results are interesting to consider along with prior findings demonstrating that even ESKD patients with extensive vascular disease burden can benefit from restoration of kidney function.42,43 Specifically, prior studies have shown that diabetes may not always improve risk stratification, such as when in the presence of cognitive impairment44 and dementia;45 patients with diabetes may reap more vascular benefits from improvements functional status than their nondiabetic counterparts since they have greater room for improvement, counterbalancing any adverse consequences that might have otherwise occurred.
Our findings that lower KPS was associated with increased risk of mortality and ACGL support prior studies with deceased-donor KT20 and other solid organ transplant recipients, including liver21,22 and lung23 transplant recipients. This study adds to these findings by including all adult KT recipients in the registry. Collectively, the literature suggests that despite differing disease symptoms and progression, functional status is associated with critical post-transplant outcomes, such as mortality, regardless of the affected organ group. Unlike prior studies, this study also accounts for the dynamic nature of functional status; it leverages KPS as both a fixed exposure at time of KT admission as well as time-varying exposure that incorporates change in KPS post-KT in the prediction of adverse outcomes. These novel results demonstrate having lower post-KT KPS puts patients at even greater risk of mortality and ACGL than those who have lower KPS at time of KT admission; accounting for improvements in KPS post-KT strengthened the association between lower KPS and post-KT mortality and ACGL.
This study is not without its limitations. We are limited by availability of data; KPS is the only available measure of functional status in the national registry, which has been shown to be subject to significant observer bias within and across transplant centers in the U.S.41 Clinicians have long questioned whether the traditional KPS is suitable for transplantation; for example, all patients on dialysis would likely score below 50 because a score of 50 equates to “requires considerable assistance and frequent medical care.” As such, each center has come up with their own methods to standardize KPS in a way that would be applicable to each respective organ group, such as use of a mortality after long transplant (MALT) score, which incorporates KPS as well as other donor and recipient factors to improve risk stratification.46 However, even after accounting for between-center variations through multilevel modeling, results were comparable to other smaller studies and to what was expected, providing some face validity. Additionally, for associations between KPS and post-KT mortality, we would be remiss not to mention the potential effects of confounding by variables not otherwise captured in the registry; it is possible that observed associations between KPS and post-KT mortality are a result of illness not captured by the registry. Such results should therefore be interpreted with caution. Notwithstanding this limitation, this study provided a diverse national cohort that improved generalizability of findings.
In conclusion, functional status, as measured by KPS, declines on average prior to KT among KT recipients. Despite observed improvements in functional status after KT, poorer functional status at admission is associated with greater mortality and ACGL among KT recipients. Associations between lower KPS and adverse outcomes was strengthened even after accounting for post-KT changes in KPS. As a result of the dynamic nature of functional status, clinicians should consider screening patients at least annually pre-KT to identify vulnerable patients with lower functional status. Identified patients can benefit from potential interventions to improve functional status, such as exercise-based prehabilitation, in hopes of reducing risk of adverse post-KT outcomes.47
Supplementary Material
Funding
Funding for this study was provided by the National Institute of Diabetes and Digestive and Kidney Disease and the National Institute of Aging: grant numbers K01AG064040 (PI: Chu), K24DK101828 (PI: Segev), R01AG055781 (PI: McAdams-DeMarco), and R01DK114074 (PI: McAdams-DeMarco).
Abbreviations
- 95%CI
95% confidence interval
- ACGL
all-cause graft loss
- aHR
adjusted hazard ratio
- ANOVA
analysis of variance
- ESKD
end-stage kidney disease
- KPS
Karnofsky Performance Score
- IQR
inter-quartile range
- KT
kidney transplant(ation)
- OPTN
Organ Procurement and Transplantation Network
- SD
standard deviation
- SRTR
Scientific Registry of Transplant Recipients
Footnotes
Disclosures
The authors declare no conflicts of interest.
REFERENCES
- 1.McAdams-DeMarco MA, Van Pilsum Rasmussen SE, Chu NM, et al. Perceptions and Practices Regarding Frailty in Kidney Transplantation: Results of A National Survey. Transplantation. 2020;104(2):349–356. [DOI] [PMC free article] [PubMed] [Google Scholar]
- 2.Kobashigawa J, Khush K, Colvin M, et al. Report From the American Society of Transplantation Conference on Donor Heart Selection in Adult Cardiac Transplantation in the United States. Am J Transplant. 2017;17(10): 2559–2566. [DOI] [PubMed] [Google Scholar]
- 3.Reese PP, Bloom RD, Shults J, et al. Functional status and survival after kidney transplantation. Transplantation. 2014;97(2): 189–195. [DOI] [PMC free article] [PubMed] [Google Scholar]
- 4.Haugen CE, Thomas AG, Chu NM, et al. Prevalence of frailty among kidney transplant candidates and recipients in the United States: Estimates from a National Registry and Multicenter Cohort Study. Am J Transplant. 2020;20(4):1170–1180 [DOI] [PMC free article] [PubMed] [Google Scholar]
- 5.Nastasi AJ, McAdams-DeMarco MA, Schrack J, et al. Pre-Kidney Transplant Lower Extremity Impairment and Post-Kidney Transplant Mortality. Am J Transplant. 2018;18(1): 189–196. [DOI] [PMC free article] [PubMed] [Google Scholar]
- 6.Chu NM, Sison S, Muzaale AD, et al. Functional independence, access to kidney transplantation and waitlist mortality. Nephrol Dial Transplant. 2020;35(5):870–877. [DOI] [PMC free article] [PubMed] [Google Scholar]
- 7.Chu NM, Gross AL, Shaffer AA, et al. Frailty and Changes in Cognitive Function after Kidney Transplantation. J Am Soc Nephrol. 2019;30(2):336–345 [DOI] [PMC free article] [PubMed] [Google Scholar]
- 8.McAdams‐DeMarco MA, Law A, Salter ML, et al. Frailty and early hospital readmission after kidney transplantation. Am J Transplant. 2013;13(8): 2091–2095. [DOI] [PMC free article] [PubMed] [Google Scholar]
- 9.McAdams-DeMarco MA, Law A, Tan J, et al. Frailty, mycophenolate reduction, and graft loss in kidney transplant recipients. Transplantation. 2015;99(4): 805–810. [DOI] [PMC free article] [PubMed] [Google Scholar]
- 10.McAdams-DeMarco MA, Law A, King E, et al. Frailty and Mortality in Kidney Transplant Recipients. Am J Transplant. 2015;15(1):149–154. [DOI] [PMC free article] [PubMed] [Google Scholar]
- 11.McAdams-DeMarco MA, King EA, Luo X, et al. Frailty, Length of Stay, and Mortality in Kidney Transplant Recipients: A National Registry and Prospective Cohort Study. Ann Surg. 2017;266(6):1084–1090. [DOI] [PMC free article] [PubMed] [Google Scholar]
- 12.Haugen CE, Chu NM, Ying H, et al. Frailty and Access to Kidney Transplantation. Clin J Tranplant. 2019;14(4): 576–582. [DOI] [PMC free article] [PubMed] [Google Scholar]
- 13.McAdams-DeMarco MA, Chu NM, Segev DL. Frailty and Long-Term Post-Kidney Transplant Outcomes. Curr Transplant Rep. 2019;6(1):45–51 [DOI] [PMC free article] [PubMed] [Google Scholar]
- 14.Haugen CE, Mountford A, Warsame F, et al. Incidence, Risk Factors, and Sequelae of Post-kidney Transplant Delirium. J Am Soc Nephrol. 2018;29(6):1752–1759. [DOI] [PMC free article] [PubMed] [Google Scholar]
- 15.McAdams-DeMarco MA, Ying H, Olorundare I, et al. Individual Frailty Components and Mortality In Kidney Transplant Recipients. Transplantation. 2017;101(9):2126–2132 [DOI] [PMC free article] [PubMed] [Google Scholar]
- 16.McAdams-DeMarco MA, Bae S, Chu N, et al. Dementia and Alzheimer’s Disease among Older Kidney Transplant Recipients. J Am Soc Nephrol. 2017;28(5):1575–1583 [DOI] [PMC free article] [PubMed] [Google Scholar]
- 17.Nastasi AJ, Bryant TS, Le JT, et al. Pre-kidney transplant lower extremity impairment and transplant length of stay: a time-to-discharge analysis of a prospective cohort study. BMC Geriatr. 2018;18(1):246. [DOI] [PMC free article] [PubMed] [Google Scholar]
- 18.Chu NM, Deng A, Ying H, et al. Dynamic Frailty Before Kidney Transplantation: Time of Measurement Matters. Transplantation. 2019;103(8):1700–1704. [DOI] [PMC free article] [PubMed] [Google Scholar]
- 19.McAdams-DeMarco MA, Isaacs K, Darko L, et al. Changes in Frailty After Kidney Transplantation. J Am Geriatr Soc. 2015;63(10):2152–2157. [DOI] [PMC free article] [PubMed] [Google Scholar]
- 20.Bui K, Kilambi V, Rodrigue JR, et ala. Patient Functional Status at Transplant and Its Impact on Posttransplant Survival of Adult Deceased-donor Kidney Recipients. Transplantation. 2019;103(5): 1051–1063. [DOI] [PMC free article] [PubMed] [Google Scholar]
- 21.Dolgin NH, Martins PN, Movahedi B, et al. Functional status predicts postoperative mortality after liver transplantation. Clin Transplant. 2016;30(11): 1403–1410. [DOI] [PubMed] [Google Scholar]
- 22.Lai JC, Feng S, Terrault NA, et al. Frailty predicts waitlist mortality in liver transplant candidates. Am J Transplant. 2014;14(8):1870–1879. [DOI] [PMC free article] [PubMed] [Google Scholar]
- 23.Grimm JC, Valero V 3rd, Kilic A, et al. Preoperative performance status impacts perioperative morbidity and mortality after lung transplantation. Ann Thorac Surg. 2015;99(2):482–489. [DOI] [PubMed] [Google Scholar]
- 24.Yates JW, Chalmer B, McKegney FP. Evaluation of patients with advanced cancer using the Karnofsky performance status. Cancer. 1980;45(8):2220–2224. [DOI] [PubMed] [Google Scholar]
- 25.Crooks V, Waller S, Smith T, et al. The use of the Karnofsky Performance Scale in determining outcomes and risk in geriatric outpatients. J Gerontol. 1991;46(4):M139–144. [DOI] [PubMed] [Google Scholar]
- 26.Mehta PD, Neale MC, Flay BR. Squeezing interval change from ordinal panel data: latent growth curves with ordinal outcomes. Psychol Methods. 2004;9(3):301–333. [DOI] [PubMed] [Google Scholar]
- 27.Chapman CR, Zaslansky R, Donaldson GW, et all. Postoperative pain trajectories in cardiac surgery patients. Pain Res Treat. 2012;2012:608359. [DOI] [PMC free article] [PubMed] [Google Scholar]
- 28.Kurella Tamura M, Vittinghoff E, Hsu CY, et al. Loss of executive function after dialysis initiation in adults with chronic kidney disease. Kidney Int. 2017;91(4):948–953. [DOI] [PMC free article] [PubMed] [Google Scholar]
- 29.Peipert JD, Caicedo JC, Friedewald JJ, et al. Trends and predictors of multidimensional health-related quality of life after living donor kidney transplantation. Qual Life Res. 2020;29(9):2355–2374. [DOI] [PubMed] [Google Scholar]
- 30.Genao L, Whitson HE, Zaas D, et al. Functional status after lung transplantation in older adults in the post-allocation score era. Am J Transplant. 2013;13(1): 157–166. [DOI] [PMC free article] [PubMed] [Google Scholar]
- 31.Little RJ, Rubin DB. Statistical Analysis With Missing Data. Hoboken, NJ: John Wiley & Sons; 2019. [Google Scholar]
- 32.Dempster AP, Laird NM, Rubin DB. Maximum likelihood from incomplete data via the EM algorithm. Journal of the Royal Statistical Society: Series B (Methodological). 1977;39(1): 1–22. [Google Scholar]
- 33.Tobin J Estimation of Relationships for Limited Dependent Variables. Econometrica. 1958;26(1): 24–36. [Google Scholar]
- 34.Beunckens C, Sotto C, Molenberghs G. A simulation study comparing weighted estimating equations with multiple imputation based estimating equations for longitudinal binary data. Computational Statistics & Data Analysis. 2008;52(3): 1533–1548. [Google Scholar]
- 35.Lai JC, Dodge JL, Sen S, et al. Functional decline in patients with cirrhosis awaiting liver transplantation: Results from the functional assessment in liver transplantation (FrAILT) study. Hepatology. 2016;63(2): 574–580. [DOI] [PMC free article] [PubMed] [Google Scholar]
- 36.Reese PP, Shults J, Bloom RD, et al. Functional status, time to transplantation, and survival benefit of kidney transplantation among wait-listed candidates. Am J Kid Dis. 2015;66(5): 837–845. [DOI] [PMC free article] [PubMed] [Google Scholar]
- 37.Reese PP, Cappola AR, Shults J, et al. Physical performance and frailty in chronic kidney disease. Am J Nephrol. 2013;38(4):307–315. [DOI] [PMC free article] [PubMed] [Google Scholar]
- 38.Roshanravan B, Khatri M, Robinson-Cohen C, et al. A prospective study of frailty in nephrology-referred patients with CKD. Am J Kid Dis. 2012;60(6): 912–921. [DOI] [PMC free article] [PubMed] [Google Scholar]
- 39.Hartmann EL, Kitzman D, Rocco M, et al. Physical function in older candidates for renal transplantation: an impaired population. Clin J Am Soc Nephrol. 2009;4(3): 588–594. [DOI] [PMC free article] [PubMed] [Google Scholar]
- 40.McAdams-DeMarco MA, Olorundare IO, Ying H, et al. Frailty and Postkidney Transplant Health-Related Quality of Life. Transplantation. 2018;102(2):291–299. [DOI] [PMC free article] [PubMed] [Google Scholar]
- 41.Snyder J, Salkowski N, Lamb K, et al. Karnofsky Performance Score and Its Use in Risk Adjustment of Transplant Outcomes in the United States. Minneapolis, MN: Scientific Registry of Transplant Recipients; 2012. [Google Scholar]
- 42.Luan FL, Samaniego M. Transplantation in diabetic kidney failure patients: modalities, outcomes, and clinical management. Semin Dial. 2010;23(2): 198–205. [DOI] [PubMed] [Google Scholar]
- 43.Guerra G, Ilahe A, Ciancio G. Diabetes and kidney transplantation: past, present, and future. Curr Diab Rep. 2012;12(5): 597–603. [DOI] [PubMed] [Google Scholar]
- 44.Chu NM, Shi Z, Haugen CE, et al. Cognitive Function, Access to Kidney Transplantation, and Waitlist Mortality Among Kidney Transplant Candidates With or Without Diabetes. Am J Kidney Dis. 2020;76(1):72–81 [DOI] [PMC free article] [PubMed] [Google Scholar]
- 45.McAdams-DeMarco MA, Daubresse M, et al. Dementia, Alzheimer’s Disease, and Mortality after Hemodialysis Initiation. Clin J Am Soc Nephrol. 2018;13(9):1339–1347. [DOI] [PMC free article] [PubMed] [Google Scholar]
- 46.Grimm JC, Valero V 3rd, Magruder JT, et al. A novel risk score that incorporates recipient and donor variables to predict 1-year mortality in the current era of lung transplantation. J Heart Lung Transplant. 2015;34(11):1449–1454. [DOI] [PubMed] [Google Scholar]
- 47.McAdams-DeMarco MA, Ying H, Van Pilsum Rasmussen S, et al. Prehabilitation prior to kidney transplantation: Results from a pilot study. Clin Transplant. 2019;33(1): e13450. [DOI] [PMC free article] [PubMed] [Google Scholar]
- 48.Schag CC, Heinrich RL, Ganz PA. Karnofsky performance status revisited: reliability, validity, and guidelines. J Clin Oncol. 1984;2(3):187–193. [DOI] [PubMed] [Google Scholar]
Associated Data
This section collects any data citations, data availability statements, or supplementary materials included in this article.