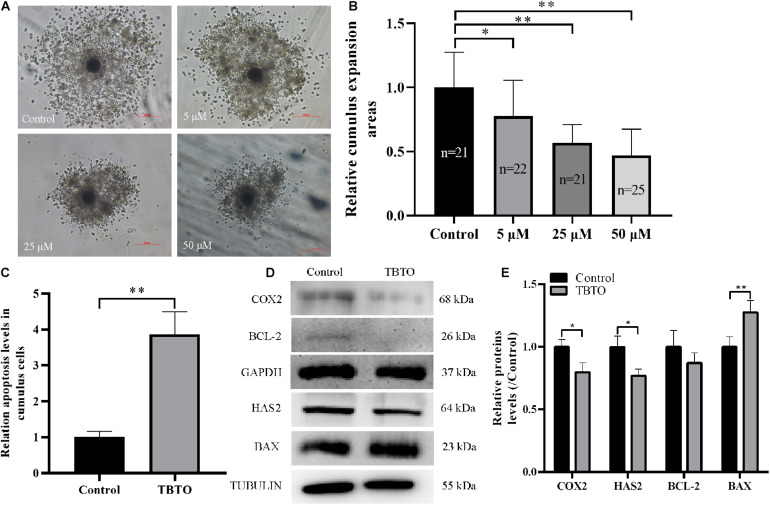
FIGURE 2.
Effects of TBTO exposure on the cumulus expansion status of porcine oocytes. (A) Representative images of cumulus expansion status in the control and TBTO exposure groups at the end of the IVM period. Scale bar = 200 μm. (B) Relative cumulus expansion areas in the control and TBTO exposure groups. (C) Relative apoptosis levels in cumulus cells between control and TBTO exposure group by flow cytometry analysis. (D) Western blotting was used to detect the protein levels in cumulus cells between control and TBTO exposure group. (E) Histogram showing the relative levels of several proteins in TBTO exposure group compared to the reference proteins in the control group. The numbers of COCs examined from the different groups are indicated by the bars. ∗p < 0.05; ∗∗p < 0.01 compared to the control.

