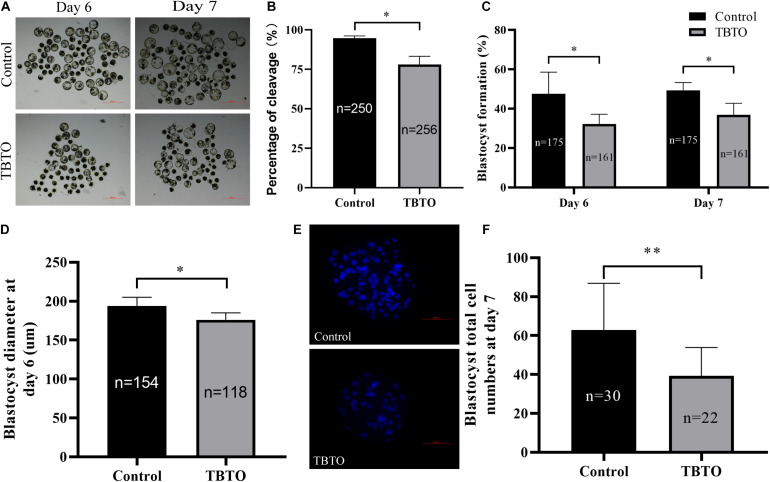
FIGURE 3.
Developmental competence of porcine oocytes after TBTO exposure. (A) Representative images of PA embryo development on day 6 (top) and day 7 (bottom) in the control and TBTO exposure group at the end of the IVM period. Scale bar = 500 μm. Percentages of cleavage (B) and blastocyst formation (C) in the control and TBTO exposure group. (D) Blastocyst diameter in the control and TBTO exposure group. (E) Representative images of Hoechst 33342 staining of blastocysts on day 7 in the control and TBTO exposure group. Scale bar = 100 μm. (F) Blastocyst total cell numbers in the control and TBTO exposure group. The numbers of embryos examined from the different groups are indicated by the bars. ∗p < 0.05; ∗∗p < 0.01 compared to the control.

