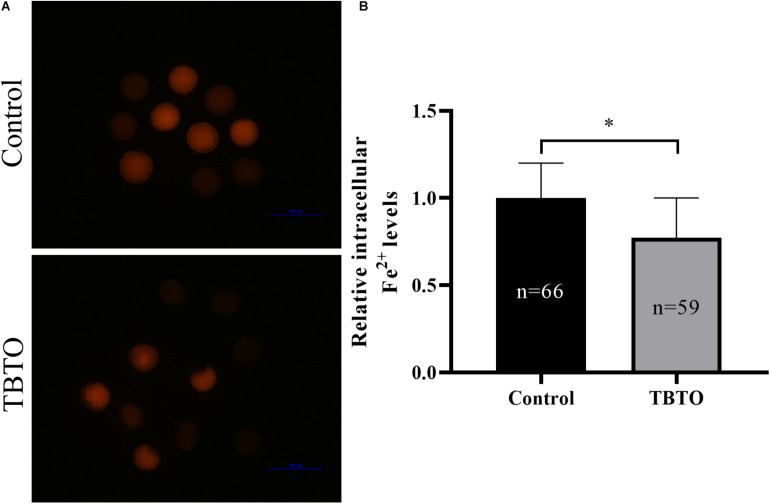
FIGURE 6.
Effect of TBTO exposure on iron homeostasis in porcine oocytes. (A) Representative fluorescence images showing intracellular ferrous ion levels in porcine oocytes in the control and TBTO exposure group at the end of the IVM period. (B) Quantification of relative intracellular ferrous ion levels in porcine oocytes from the control and TBTO exposure group. The numbers of oocytes examined from the different groups are indicated by the bars. ∗p < 0.05 compared to the control.

