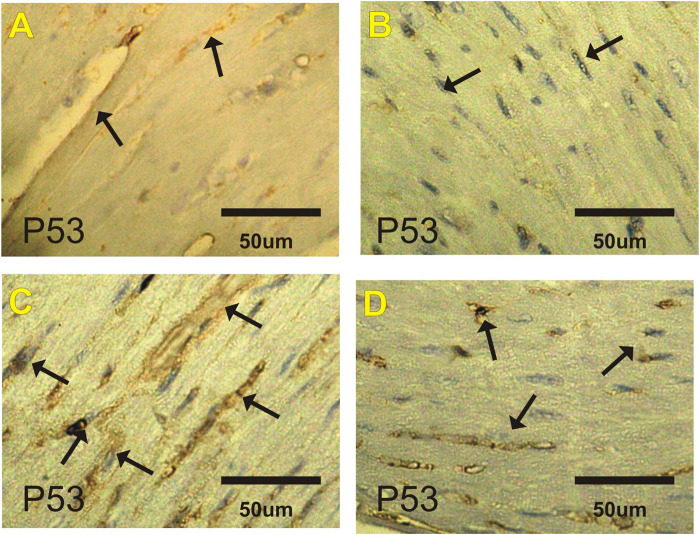
FIGURE 3.
Photomicrographs of heart sections from the different experimental groups stained with p53-ir. Faint p53-ir reactions (arrows) are shown in the (A) control and (B) costus groups. (C) Severe positive reactions (arrows) for p53-ir are shown in the EST group. (D) Mild reactions (arrows) for p53-ir are shown in the EST group treated with costus. p53-ir, p53 immunoreactivity; EST, Ehrlich solid tumor.

