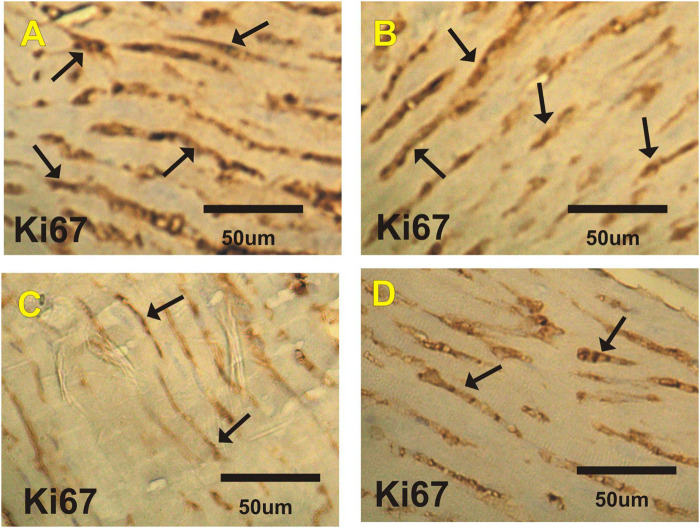
FIGURE 5.
Photomicrographs of heart sections from the different experimental groups stained with Ki67-ir. Severe positive reactions (arrows) are shown for Ki67 expression in cardiac sections in the (A) control and (B) costus groups. (C) The EST group shows mild positive reactions for Ki67 expression. (D) The EST group treated with costus shows moderate reactions (arrows) for Ki67 expression. Ki67-ir, Ki67 immunoreactivity; EST, Ehrlich solid tumor.

