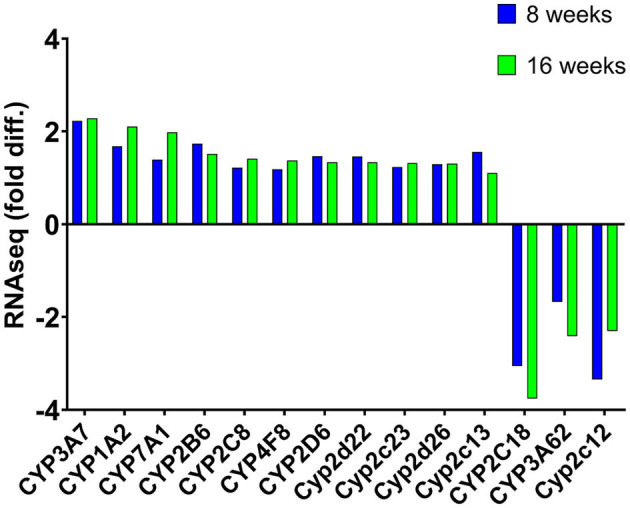
Figure 1.

Mean expression (fold difference) of differentially expressed cytochrome P450 (CYP) genes (listed in IPA) that were observed to be expressed at both 8 and 16 weeks in rats fed with the SPI diet compared to those fed with the CAS diet. Positive values indicate upregulation, whereas negative values represent downregulation of these genes. Values represent the mean of 8–10 observations and bars with an asterisk (*) were significant (P < 0.05). Cyp2c13 was significant after 8 weeks of soy feeding (p = 4.58 × 10−05) but not after 16 weeks of soy feeding (p = 0.24).
