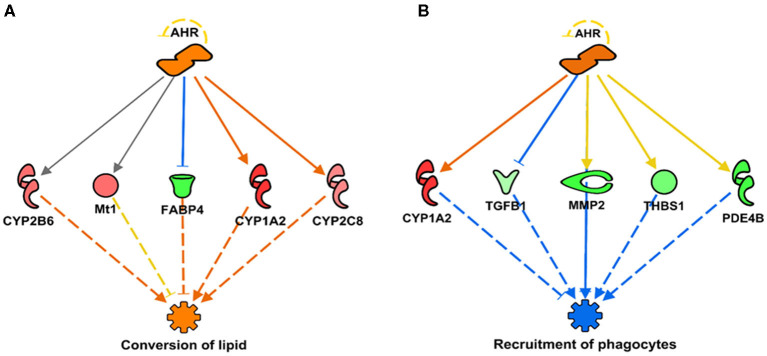
Figure 3.
Regulator networks illustrating the role of aryl hydrocarbon receptor (AHR) as the master regulator in a component of lipid metabolism and inflammatory response. (A) Conversion of lipid (Z-score = 2.09, p = 2.77 × 10−08), predicted to be activated in SPI diet; (B) recruitment of phagocytes (Z-score = –2.31, p = 2.10 × 10−05), predicted to be inhibited. Both networks have in common the upregulation of CYP1A2 as indirect result of AHR activation (activation Z-score = 2.15, p = 4.20 × 10⁻¹¹). Genes in pink or red were upregulated in the SPI-fed rats, whereas those in green were downregulated in SPI- vs. CAS-fed rats. Gene names and fold differential expression in the regulatory networks are CYP1A2 (Cytochrome P450 Family 1 Subfamily A Member 2, 2.11), FABP4 (Fatty Acid Binding Protein 4, −1.91), CYP2B6 (Cytochrome P450 Family 2 Subfamily B Member 6, 1.51), Mt1 (Metallothionein 1, 1.52), CYP2C8 (Cytochrome P450 Family 2 Subfamily C Member 8, 1.41), TGFB1 (transforming growth factor beta 1, –1.33), MMP2 (matrix metallopeptidase 2, –1.96), PDE4B (phosphodiesterase 4B, –1.93), and THBS1 (thrombospondin 1, –1.63).

