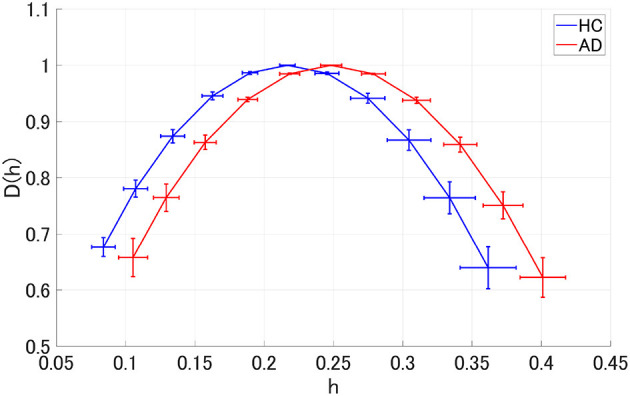
Figure 2.

Singular value spectra of Alzheimer's disease (AD) group and HC group. The mean and standard deviation among each group of D(h) and h. Since the distribution is wide, it is considered that it reflects the multi-fractal property of both groups' EEG signal.
