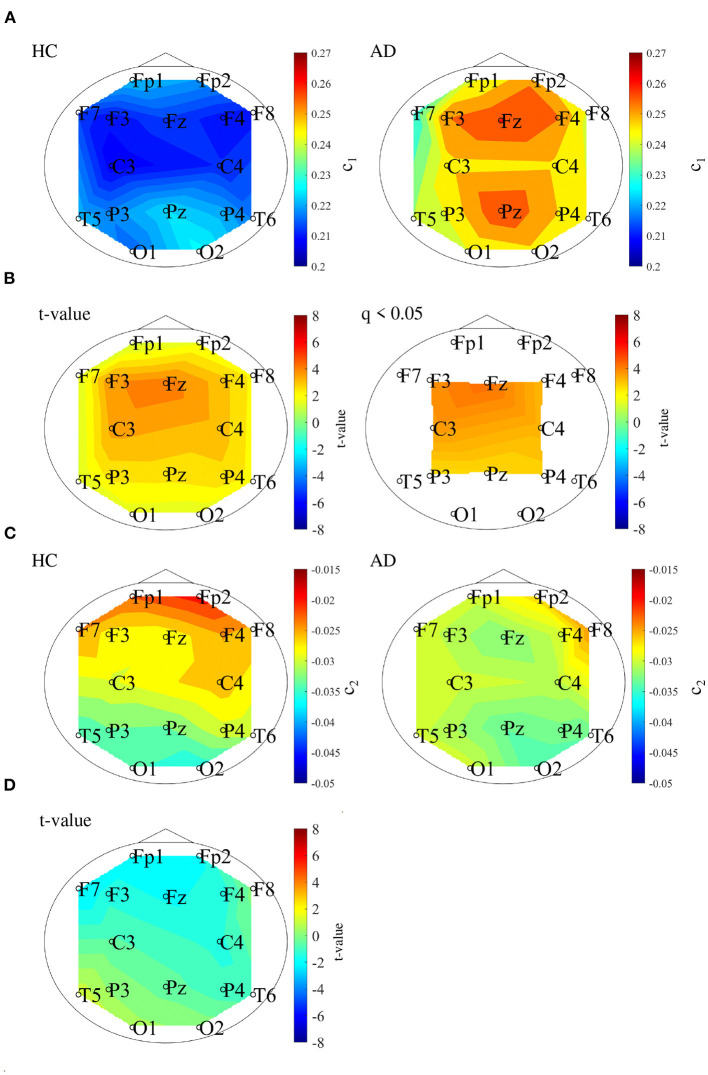
Figure 3.
(A) 1st cumulant of singular value spectrum c1. Mean value of c1 in the HC (left) and AD (right) groups. (B) t-values between the AD and HC groups. The warm (cold) color represents higher (smaller) c1 values of AD than those for HC. The left and right correspond to the t-value and t-value satisfying the false discovery rate (FDR) correction criteria q < 0.050 corresponding to (p < 0.012). c1 of the AD group had significantly higher values at F3, Fz, F4, C3, C4, P3, Pz, and P4. (C) 2nd cumulant of singular value spectrum c2. Mean value of c2 in the HC (left) and AD (right) groups. (D) t-value between the AD and HC groups warm (cold) color represents higher (smaller) c2 values of AD than those for HC. There are no-significant high/low t-values satisfying FDR correction criteria q < 0.05 (corresponding to p < 0.003).

