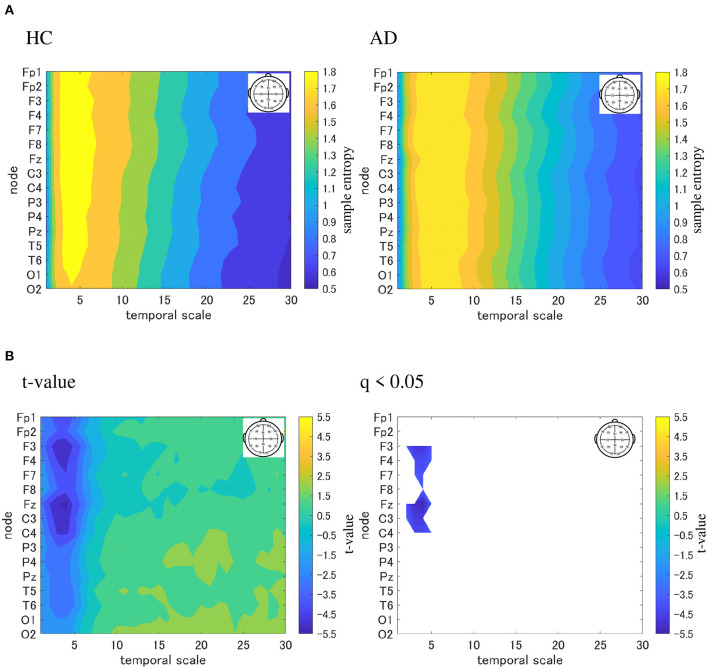
Figure 4.
Multi-scale entropy analysis in HC and AD group. The horizontal axis represents the temporal-scale factor, τ . (A) Mean values of sample entropy from 1 (0.005 s) to 30 (0.15 s) scale factors in HC (left part) and AD (right part). (B) t-value between the AD and HC groups(left part). The warm (cold) color represents a higher (smaller) sample entropy value for AD than that for HC. The t-value satisfying the FDR correction criteria q < 0.050 corresponding to (p < 0.002). Significantly smaller sample entropy of AD low temporal scale regions 1 to 5 (0.005 to 0.025 s).

