
Figure 1.
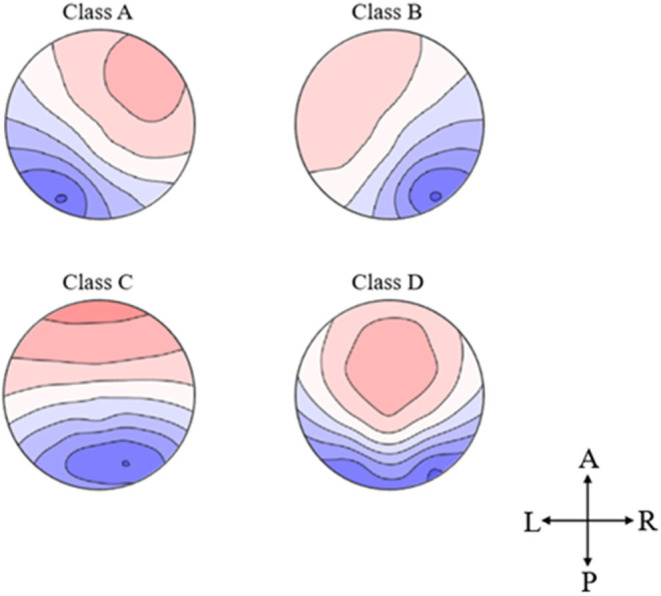
Topographical microstate maps. The figure shows the resulting four microstates, which are labeled according to previous literature. The different colors signify the different polarities. The maps are represented as seen from above (A, Anterior; P, Posterior; L, Left; R, Right).