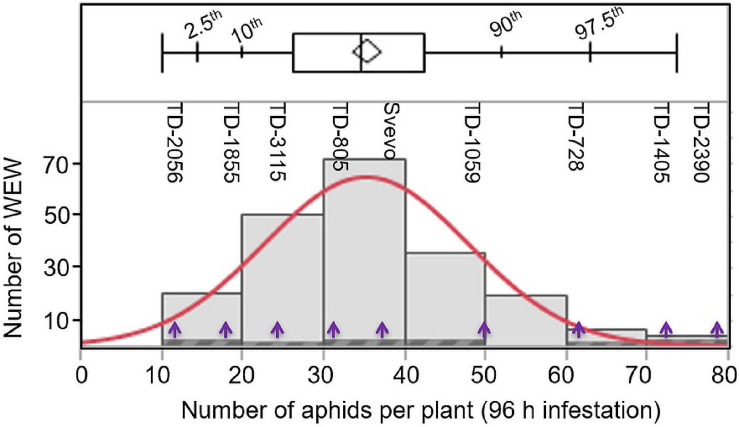
FIGURE 1.
Distribution of 203 wild emmer wheat (WEW) accessions according to their aphid performance. The total aphids per plant (X-axis) were evaluated after 96 h following infestation using a whole cage bioassay (n = 8). The distribution ranged from 10 to 80 aphids per plant using the Shapiro–Wilk test shown in red color (p < 0.0025). The plot above the histogram displays the quantile box plot with quantile marks (2.5th, 10th, 90th, and 97.5th quantile). The Y-axis represents the number of WEW genotypes in each bin. The purple arrows indicate the nine selected WEW accessions further used in this study.

