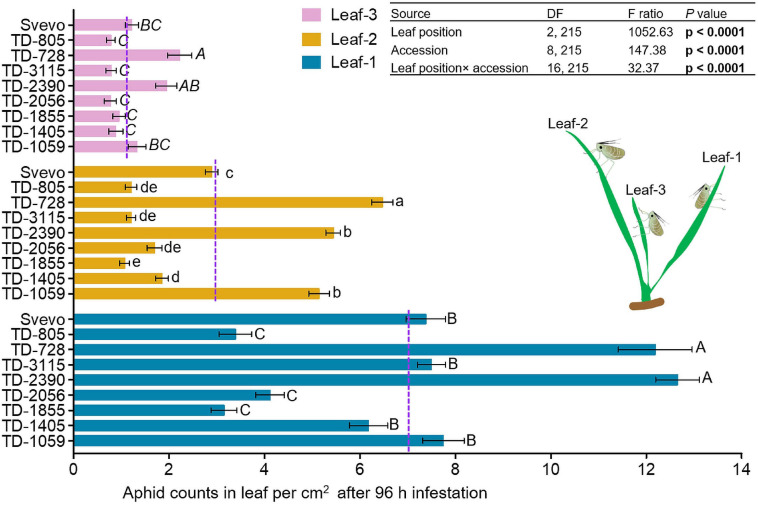
FIGURE 2.
Spatial performance of aphids on selected wheat genotypes. Aphid performance was evaluated in three leaf positions: leaf-1, leaf-2, and leaf-3. The number of total aphids per cm2 in each leaf was shown at 96 h following infestation with Rhopalosiphum padi using the choice whole cage bioassay (mean ± SE, n = 8). The dashed purple lines represent the mean value of aphids per cm2 on an individual leaf type among the accessions. The effects of leaf position, accession, and their interaction (leaf position × accession) were tested by two-way analysis of variance (ANOVA) analyses. In bold are the parameters that were significantly affected, p < 0.05. Significant differences between accessions are indicated by different letters (one-way ANOVA, Tukey’s honestly significant difference test, p < 0.05).

