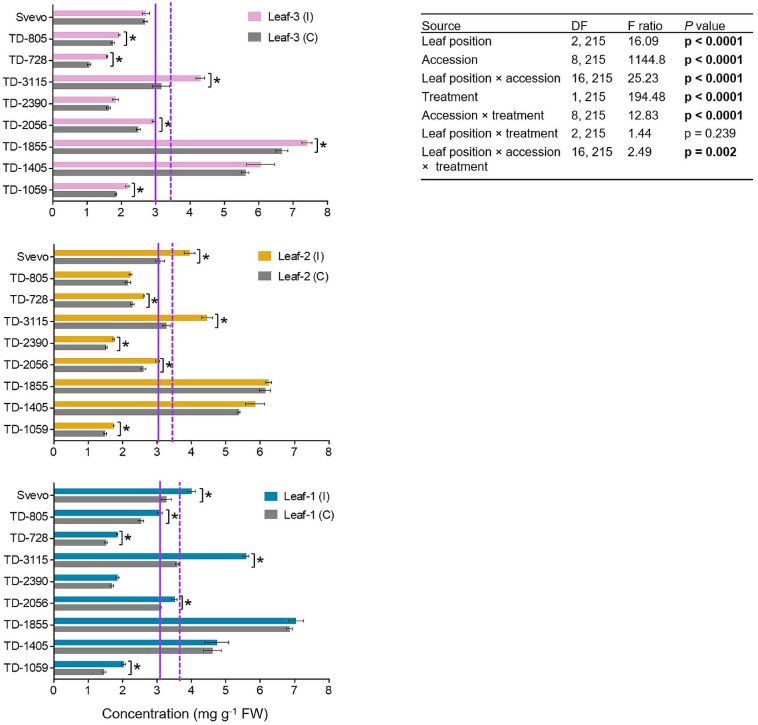
FIGURE 4.
The levels of DIMBOA of nine selected wheat genotypes. The content of the BXD, DIMBOA, (mg per g FW) was evaluated in leaf-1, leaf-2, and leaf-3 in untreated controls (C) and 96 h following infestation (I) with R. padi using the choice whole cage bioassay. Values are expressed as mean ± SE (n = 4). The solid and dashed purple lines represent the mean value of each leaf type under control and infested conditions among the accessions, respectively. The effects of leaf position, accession, treatment, and their interaction (leaf position × accession × treatment) were tested by two-way ANOVA analyses. The asterisk represents the significant difference between treatments in a particular accession analyzed by Student’s t-tests (p < 0.05). In bold are the parameters that were significantly affected, p < 0.05.

