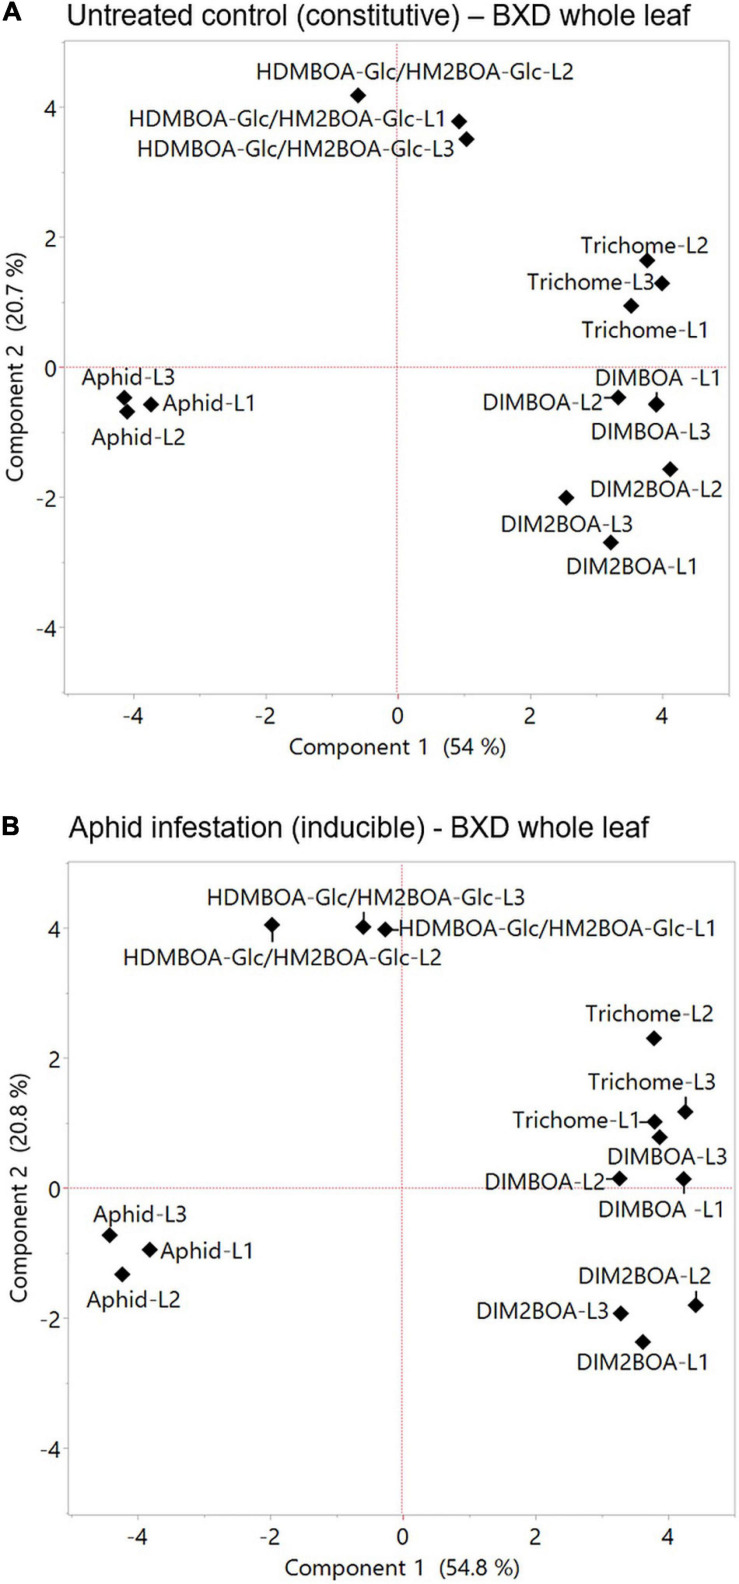
FIGURE 7.
Principal component analysis plots of plants’ physical and chemical defense parameters measured at the whole leaf level. The relation between trichome density, BXDs of the three leaves (leaf-1 [L1], leaf-2 [L2], and leaf-3 [L3]) under untreated control (A), and aphid infestation (B) on aphid reproduction. The data for the aphid bioassay, trichomes, and BXDs were normalized to log2 transformation for the projection of PCA. The accessions that were tested in this analysis are TD-728, TD-805, TD-1059, TD-1405, TD-1855, TD-2056, TD-2390, TD-3115, and Svevo, the domesticated durum wheat.

