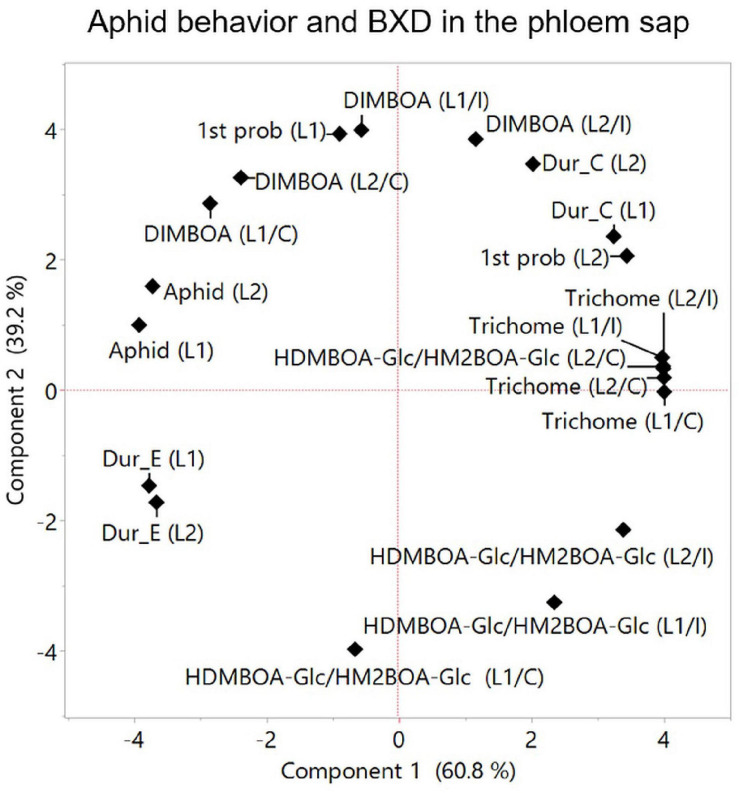
FIGURE 9.
Principal component analysis plot for parameters measured at the phloem level. Aphid feeding behavior was analyzed using the EPG technique only for two leaves (leaf-1 [L1] and leaf-2 [L2], and results were integrated to aphid progeny, trichome density, and BXDs (DIMBOA and HDMBOA-Glc/HM2BOA-Glc) detected in the phloem sap. The data for the trichomes and BXDs are the constitutive levels [C] and aphid-induced [I]. Average values were normalized to log2 transformation for the projection of PCA. The accessions that were tested in this analysis are TD-805, TD-2056, and Svevo.

