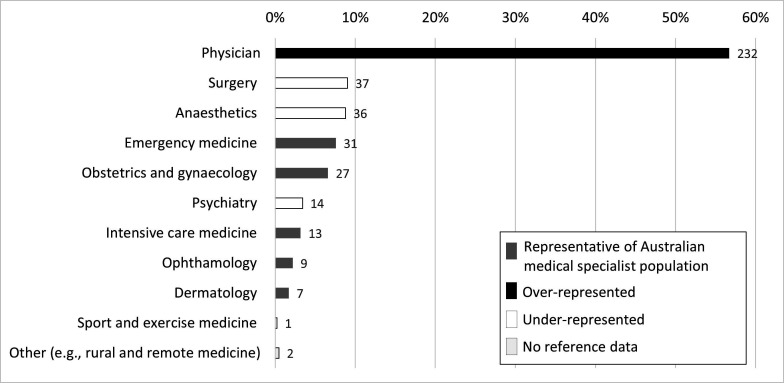
Figure 2.
Proportion of each reported primary specialty in the sample (n=409) grouped by primary medical college affiliation. Grey bars signify specialties where proportions were representative of the medical specialist population when compared with reference data.27 The black bar signifies a specialty which was over-represented (physicians; p<0.0001). White bars signify specialties which were under-represented: anaesthesiology (p=0.002), psychiatry (p<0.0001) and surgery (p<0.0001). The reference data did not include a classification for ‘rural and remote medicine’, so representativeness could not be determined for this specialty (pale grey bar).

