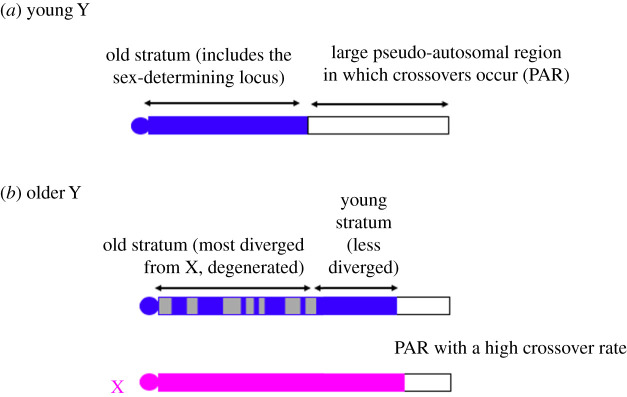
Figure 1.
Schematic diagram of sex chromosome evolution: (a) shows a young XY pair with a fully sex-linked region (solid blue) that has not yet degenerated and a partially sex-linked region (or pseudo-autosomal region or PAR, white); (b) shows a later stage, in a pair that has evolved a second, younger fully non-recombining stratum that has not yet degenerated, while the older stratum has become partially degenerated, with the loss of genes symbolized by grey regions; the evolution of this new stratum involved part of the PAR stopping recombination, so that this XY pair has a smaller PAR than the younger one. The diagram shows the Y chromosome as the same size as the X, but the deletion of degenerated regions might occur, and/or accumulation of repetitive sequences in the fully sex-linked strata causing a physical expansion. (Online version in colour.)

