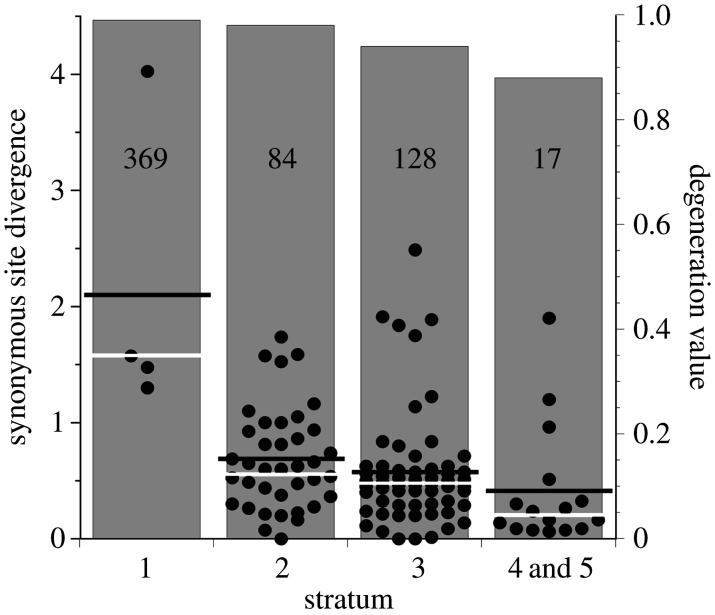
Figure 2.
Genetic degeneration of the human Y, based on the comprehensive list of genes inferred to have been present on the ancestral mammalian X chromosome, including stratum 1, which is sex-linked in marsupials [29]. The grey bars and right-hand y axis show the estimated proportions of non-functional genes in different strata. The left-hand y axis shows Y–X synonymous site divergence estimates (Ks values) for each stratum. The figure also illustrates the loss of genes, as the numbers of XY pairs remaining for estimating Ks values are much smaller for the oldest stratum. The numbers of ancestrally X-linked genes in each stratum are also indicated (in the boxes; strata 4 and 5 are combined, because they include few genes). The horizontal white and black lines are the median and mean Ks values, respectively.

