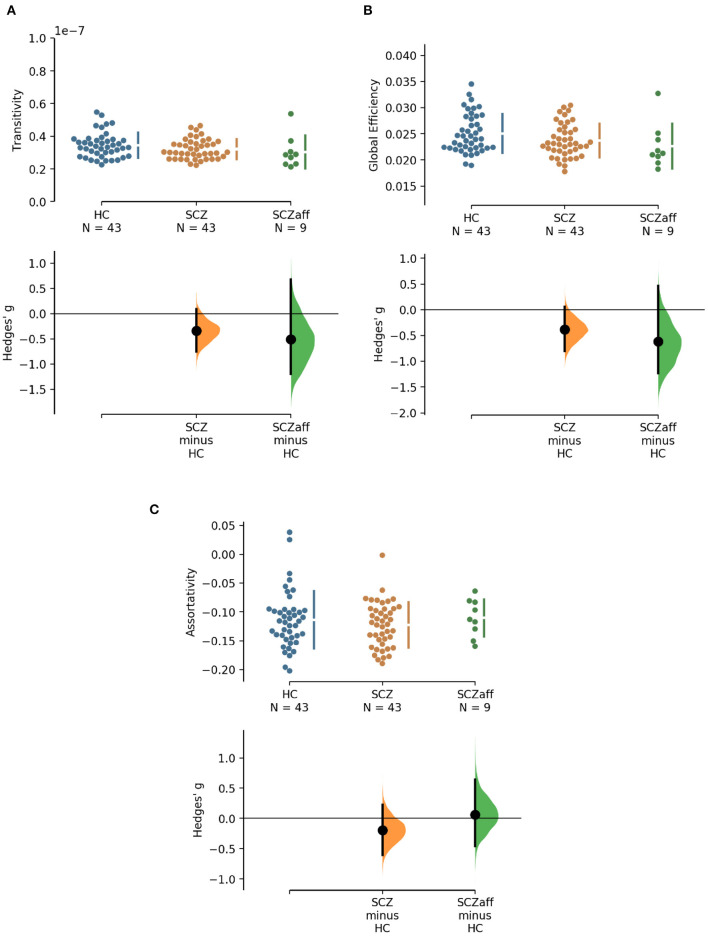
Figure 2.
Hedge's g for the comparisons of various graph measures for the SCZ and SCZaff groups against the HC group are shown in the above Cumming estimation plot. The raw data is plotted on the upper axes. On the lower axes, mean differences are plotted as bootstrap sampling distributions. Each mean difference is depicted as a dot. Each 95% confidence interval is indicated by the ends of the vertical error bars [see (30)]. Panels show (A) transitivity (measure of segregation), (B) global efficiency (measure of integration), and (C) assortativity (measure of resilience).

