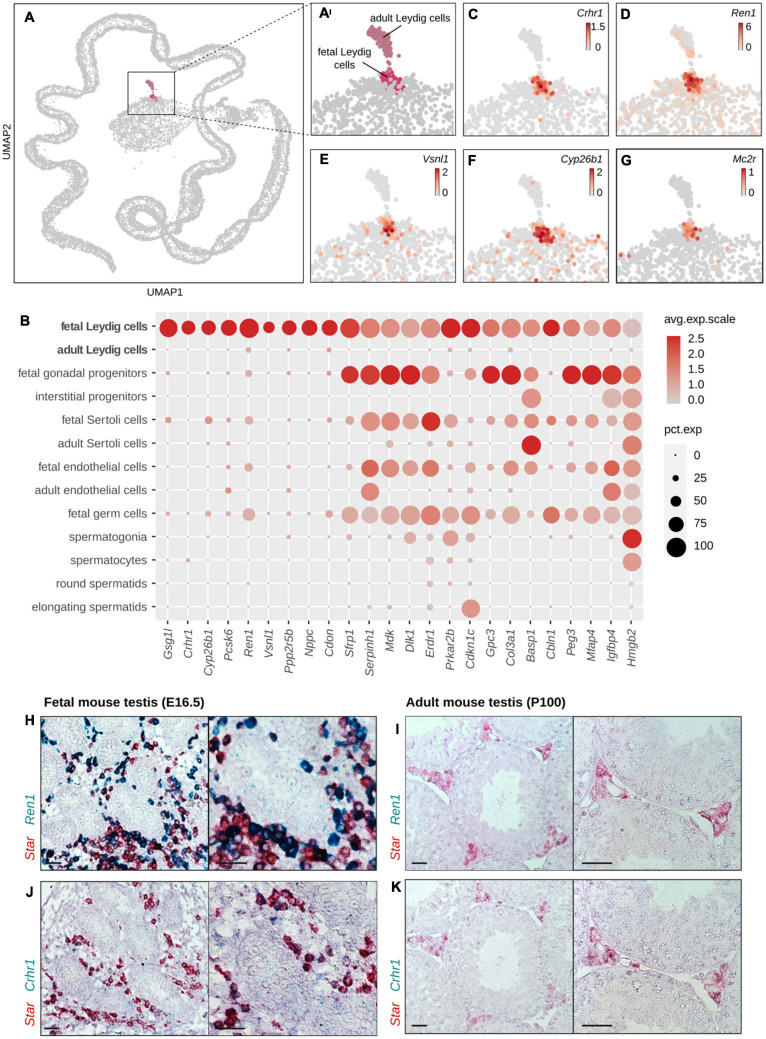
FIGURE 4.
Identification of genes labeling FLCs. (A,A′) UMAP representation of single-cell transcriptomes highlighting the two Leydig cell populations: fetal Leydig cells (FLCs) in pink and adult Leydig cells (ALCs) in gray pink. The other populations of the testis are colored in gray. (C–G) Enlargement on the UMAP representation colored according to the normalized expression of selected FLC-specific candidate marker genes, like Crhr1 (C), Ren1 (D), Vsnl1 (E), Cyp26b1 (F), and Mc2r (G). (B) Dotplot displaying the scaled expression of the FLC-specific candidate genes, and the top 15 non-specific candidates discriminating FLCs over ALCs. (H–K) In situ hybridization assay by RNAscope labeling in red Star, a known marker of Leydig cells, and in green the FLC marker Ren1 (H,I) and Crhr1 (J,K) in embryonic mouse testis at E18.5 (H,J) and in adult mouse testis at P100 (I,K). The colocalisation of the red and green probes indicate a co-expression of the two genes in the Leydig cells. The black scale bar corresponds to 100 μm.

