
FIGURE 1.
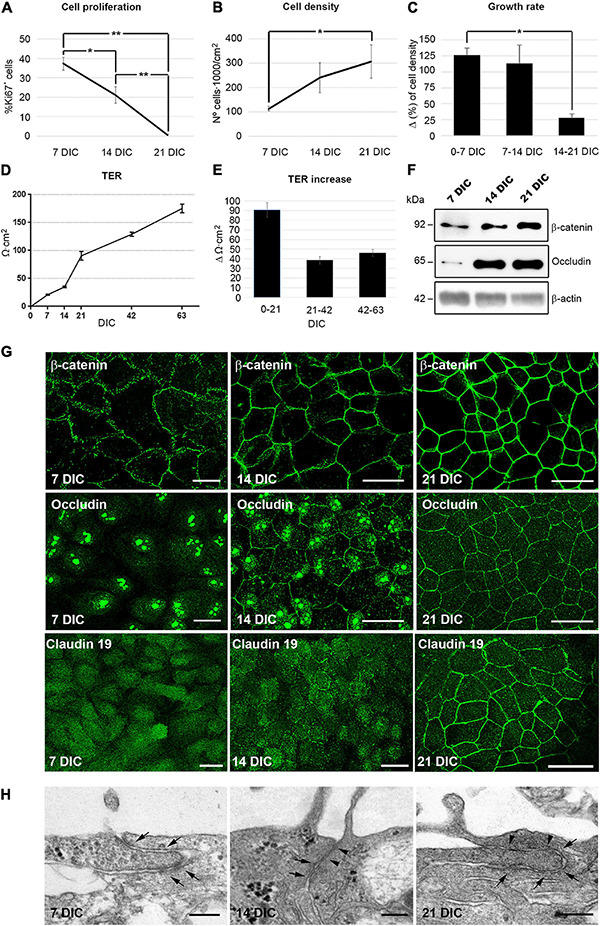
Hf-RPE cells differentiate within 21 DIC. (A) Graphical representation of the decrease in the number of proliferating cells from 7 to 21 DIC, (B) the increase in cell density from 7 to 21 DIC and (C) the decrease in the growth rate expressed as increment (Δ) in cell density within 7 days’ time frames. (D) Graphical representation of the highly significant increase of TER in the Hf-RPE cells from 7 to 63 DIC and (E) average TER increase within periods of 21 days. (F) Western blot analyses showing the expression of adherens junction protein β-catenin and tight junctions protein occludin from 7 DIC onward. β-actin was used as the loading control. (G) Confocal microscopy images of β-catenin localization at the plasma membrane from 7 DIC forward, occludin from 14 DIC forward, and claudin-19 from 21 DIC. (H) Electron microscopy micrographs showing that adherens junctions are present from 7 DIC onward (arrows), and tight junctions are present from 14 DIC (arrowheads) in Hf-RPE cells in culture. Scale bars in (G): 25 μm, (H): 200 nm. *Significant difference, p < 0.05, **highly significant difference, p < 0.01.