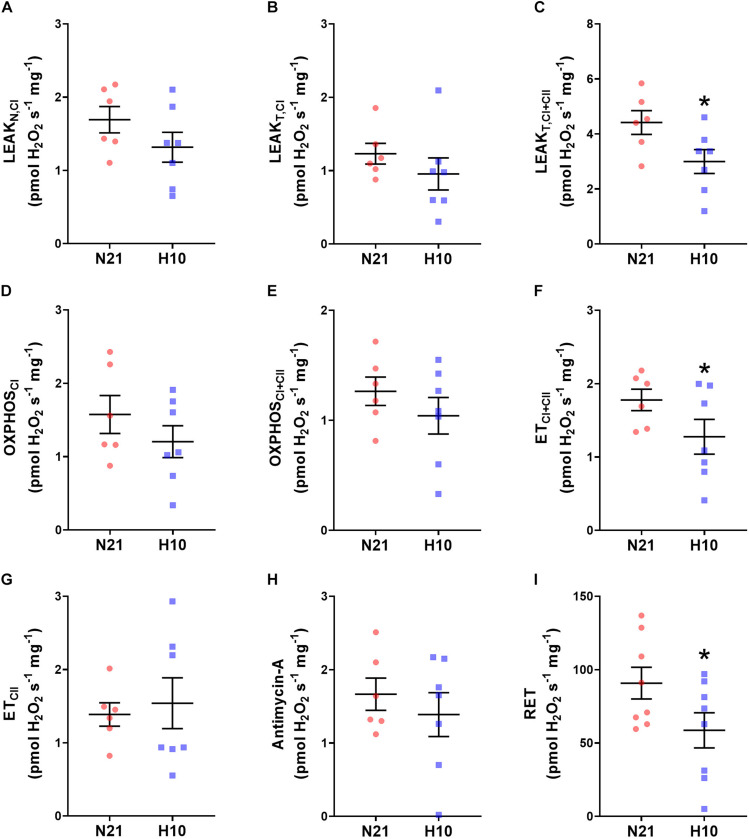
FIGURE 3.
Effect of developmental hypoxia on mitochondrial H2O2 production. Mitochondrial H2O2 production was measured in juvenile snapping turtles from normoxic (N21, red circles, n = 6) and hypoxic H10 (blue squares, n = 7) incubation. Each panel represents a respiratory state. (A) Leak respiration with substrates for complex I, in the absence of adenylates (LeakN,CI). (B) Leak respiration with substrates for complex I, in the presence of adenylates (LeakT,CI). (C) Leak respiration with substrates for complexes I and II, in the presence of adenylates (LeakT,CI+CII). (D) Oxidative phosphorylation, with substrates for complex I (OXPHOSCI). (E) Oxidative phosphorylation, with substrates for complexes I and II (OXPHOSCI+CII). (F) Electron-transfer capacity, with substrates for complexes I and II (ETCI+CII). (G) Electron-transfer capacity, with substrates for complex II (ETCII). (H) Electron-transfer capacity, in the presence of antimycin-A. (I) Electron-transfer capacity during reverse electron transport (RET), in the presence of succinate. Statistical significance was assessed with individual generalized linear models, followed by Sidak post hoc tests, to assess the effect of developmental O2 (N21 vs. H10). Values were considered significant when P ≤ 0.05, which are denoted by asterisks (*).

